
Original app-reported results
Real driver earnings, week by week
Browse original weekly summaries provided by active drivers, organized newest first. Each result keeps the earnings, online time, and trip count together for context. A planning example below shows how rental and estimated fuel costs could affect a week.
Real submitted results
What drivers are actually earning
In a week
$1,475.57 – $3,612.96
39 full-week screenshots
In a day
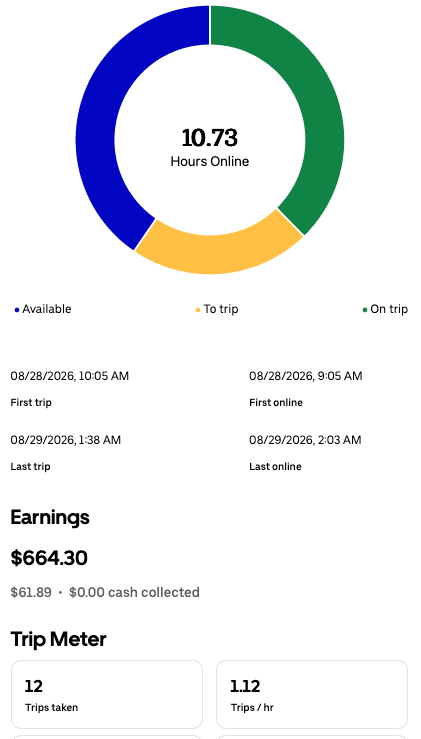
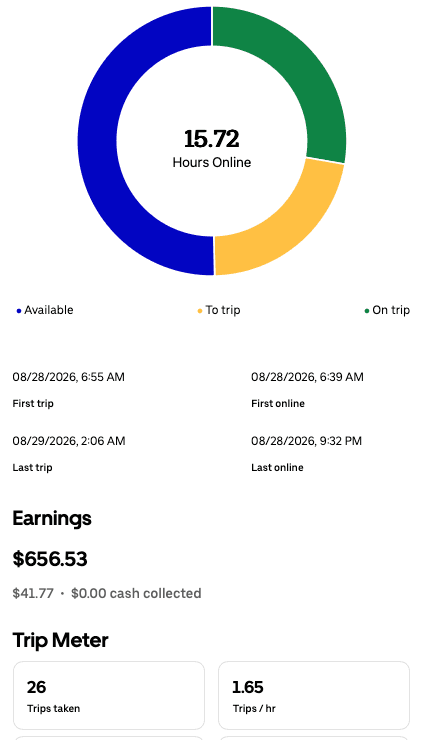
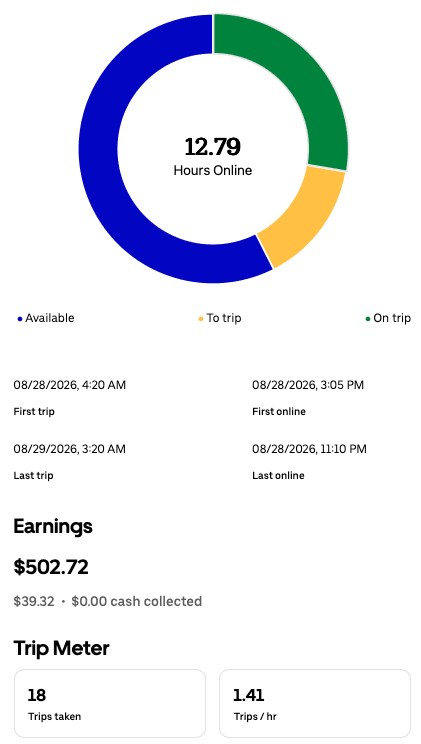
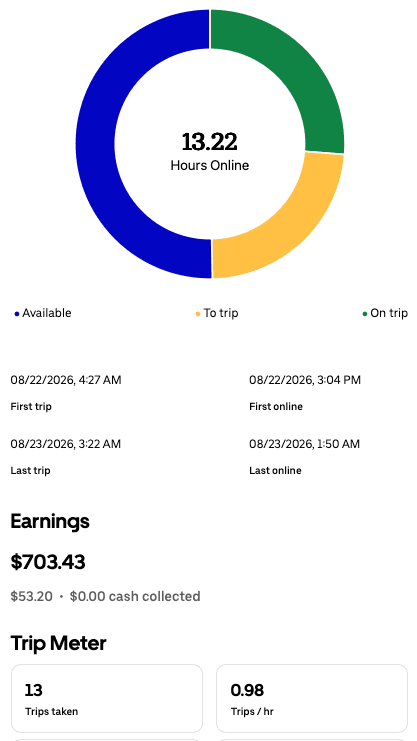
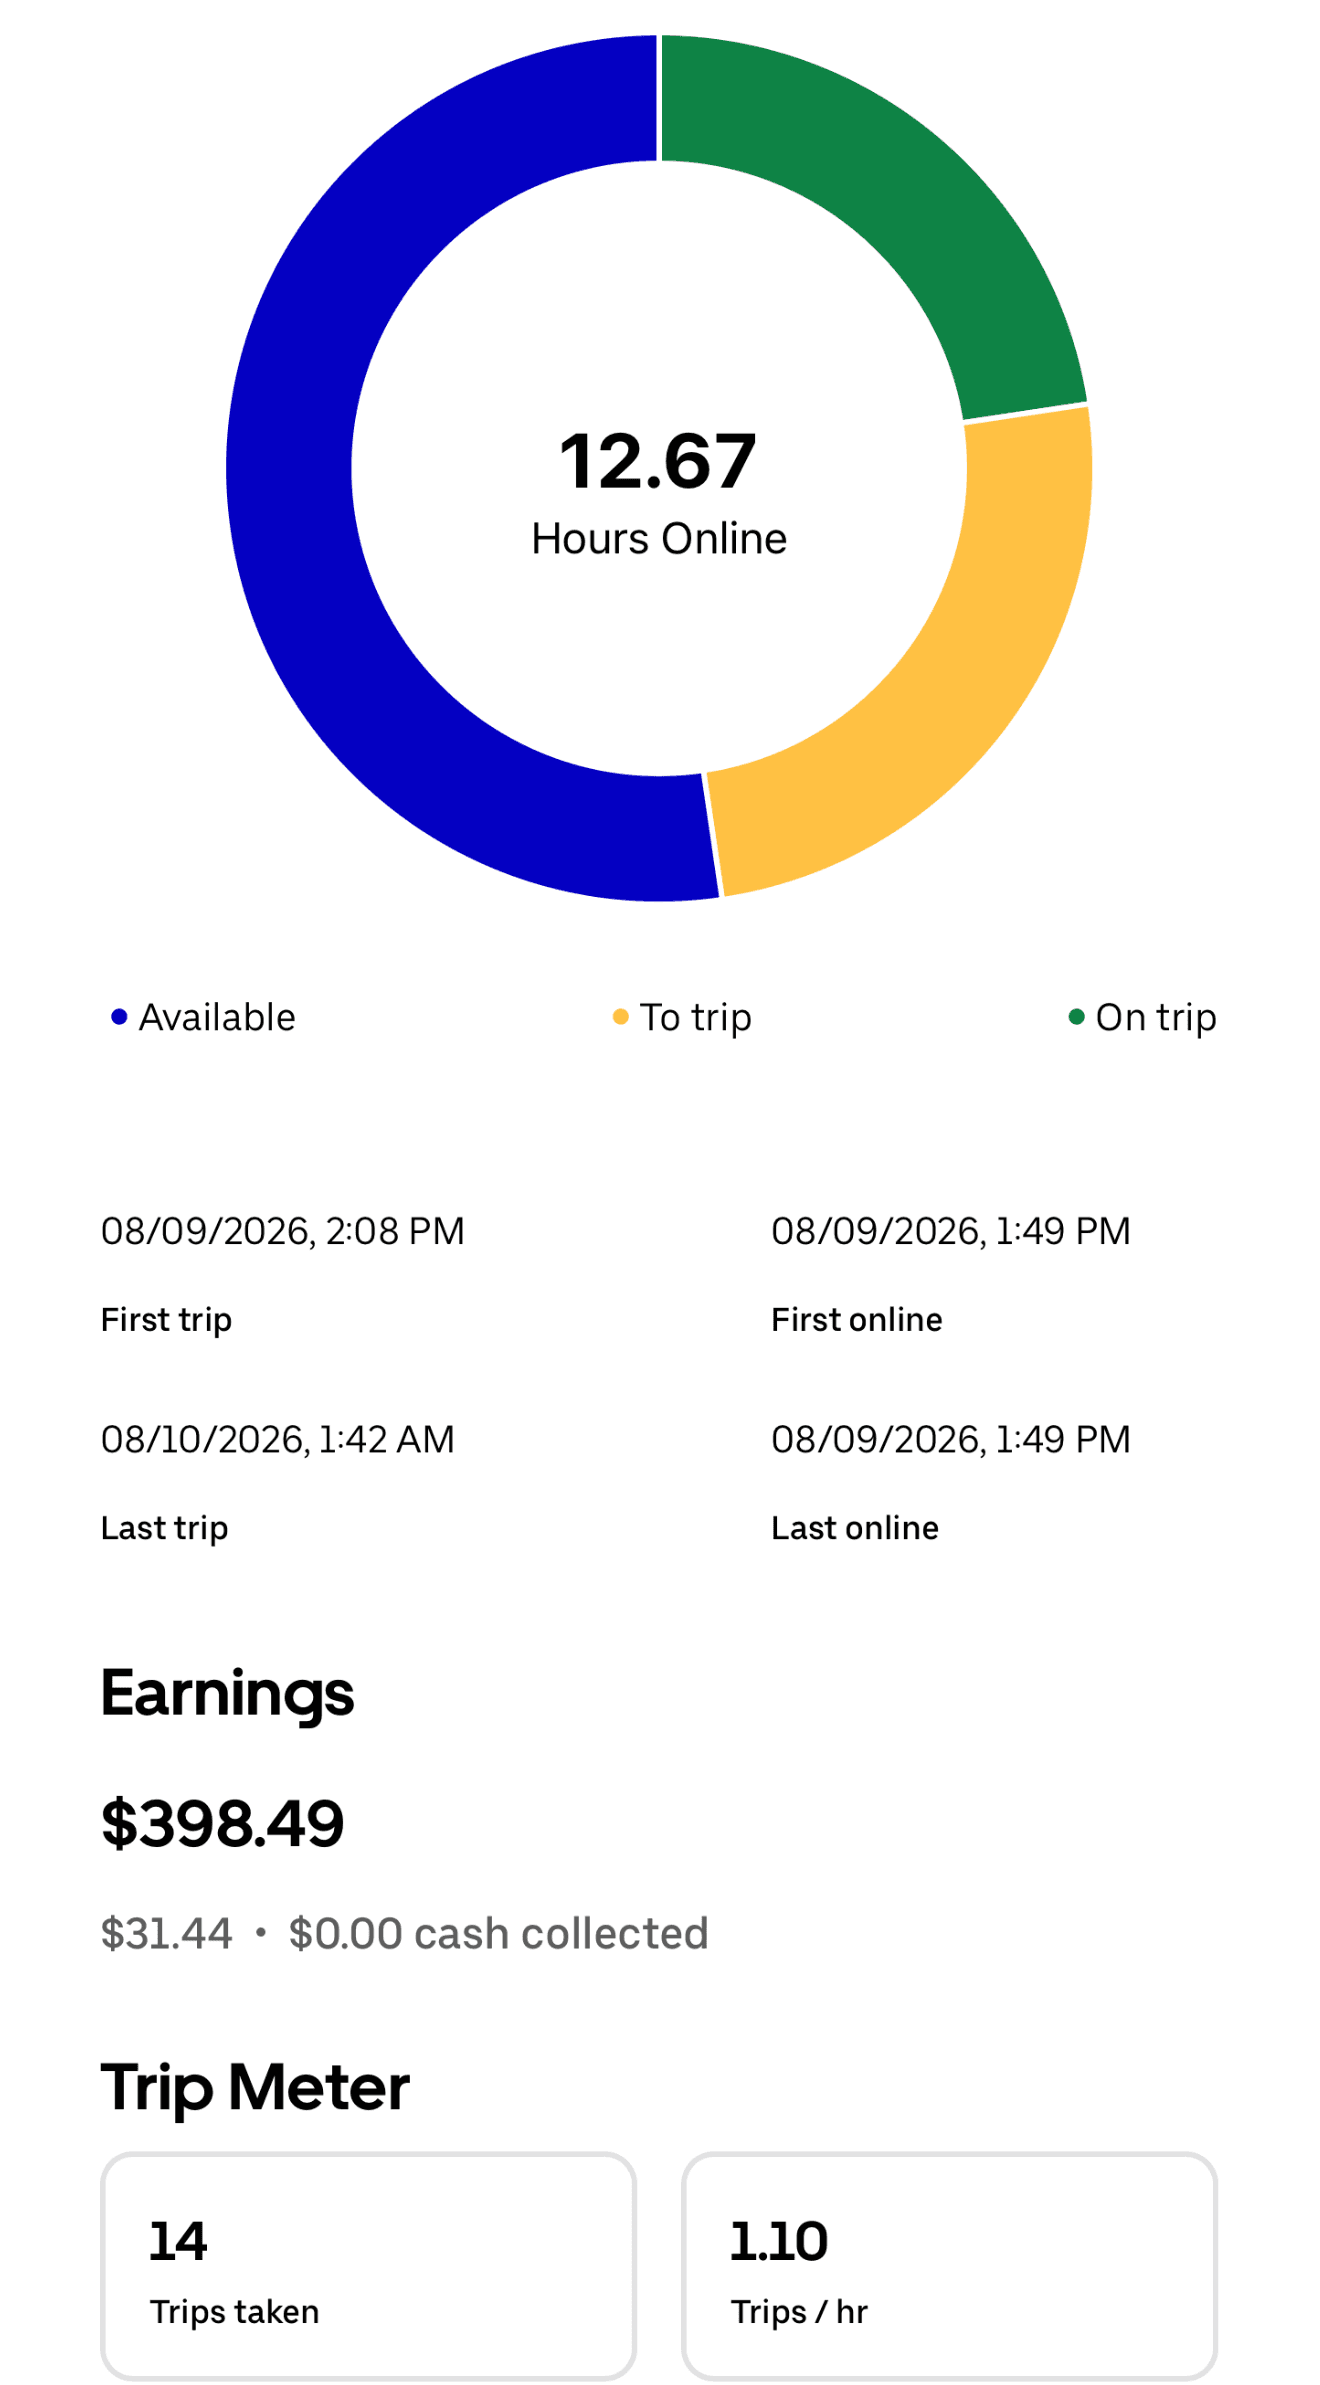
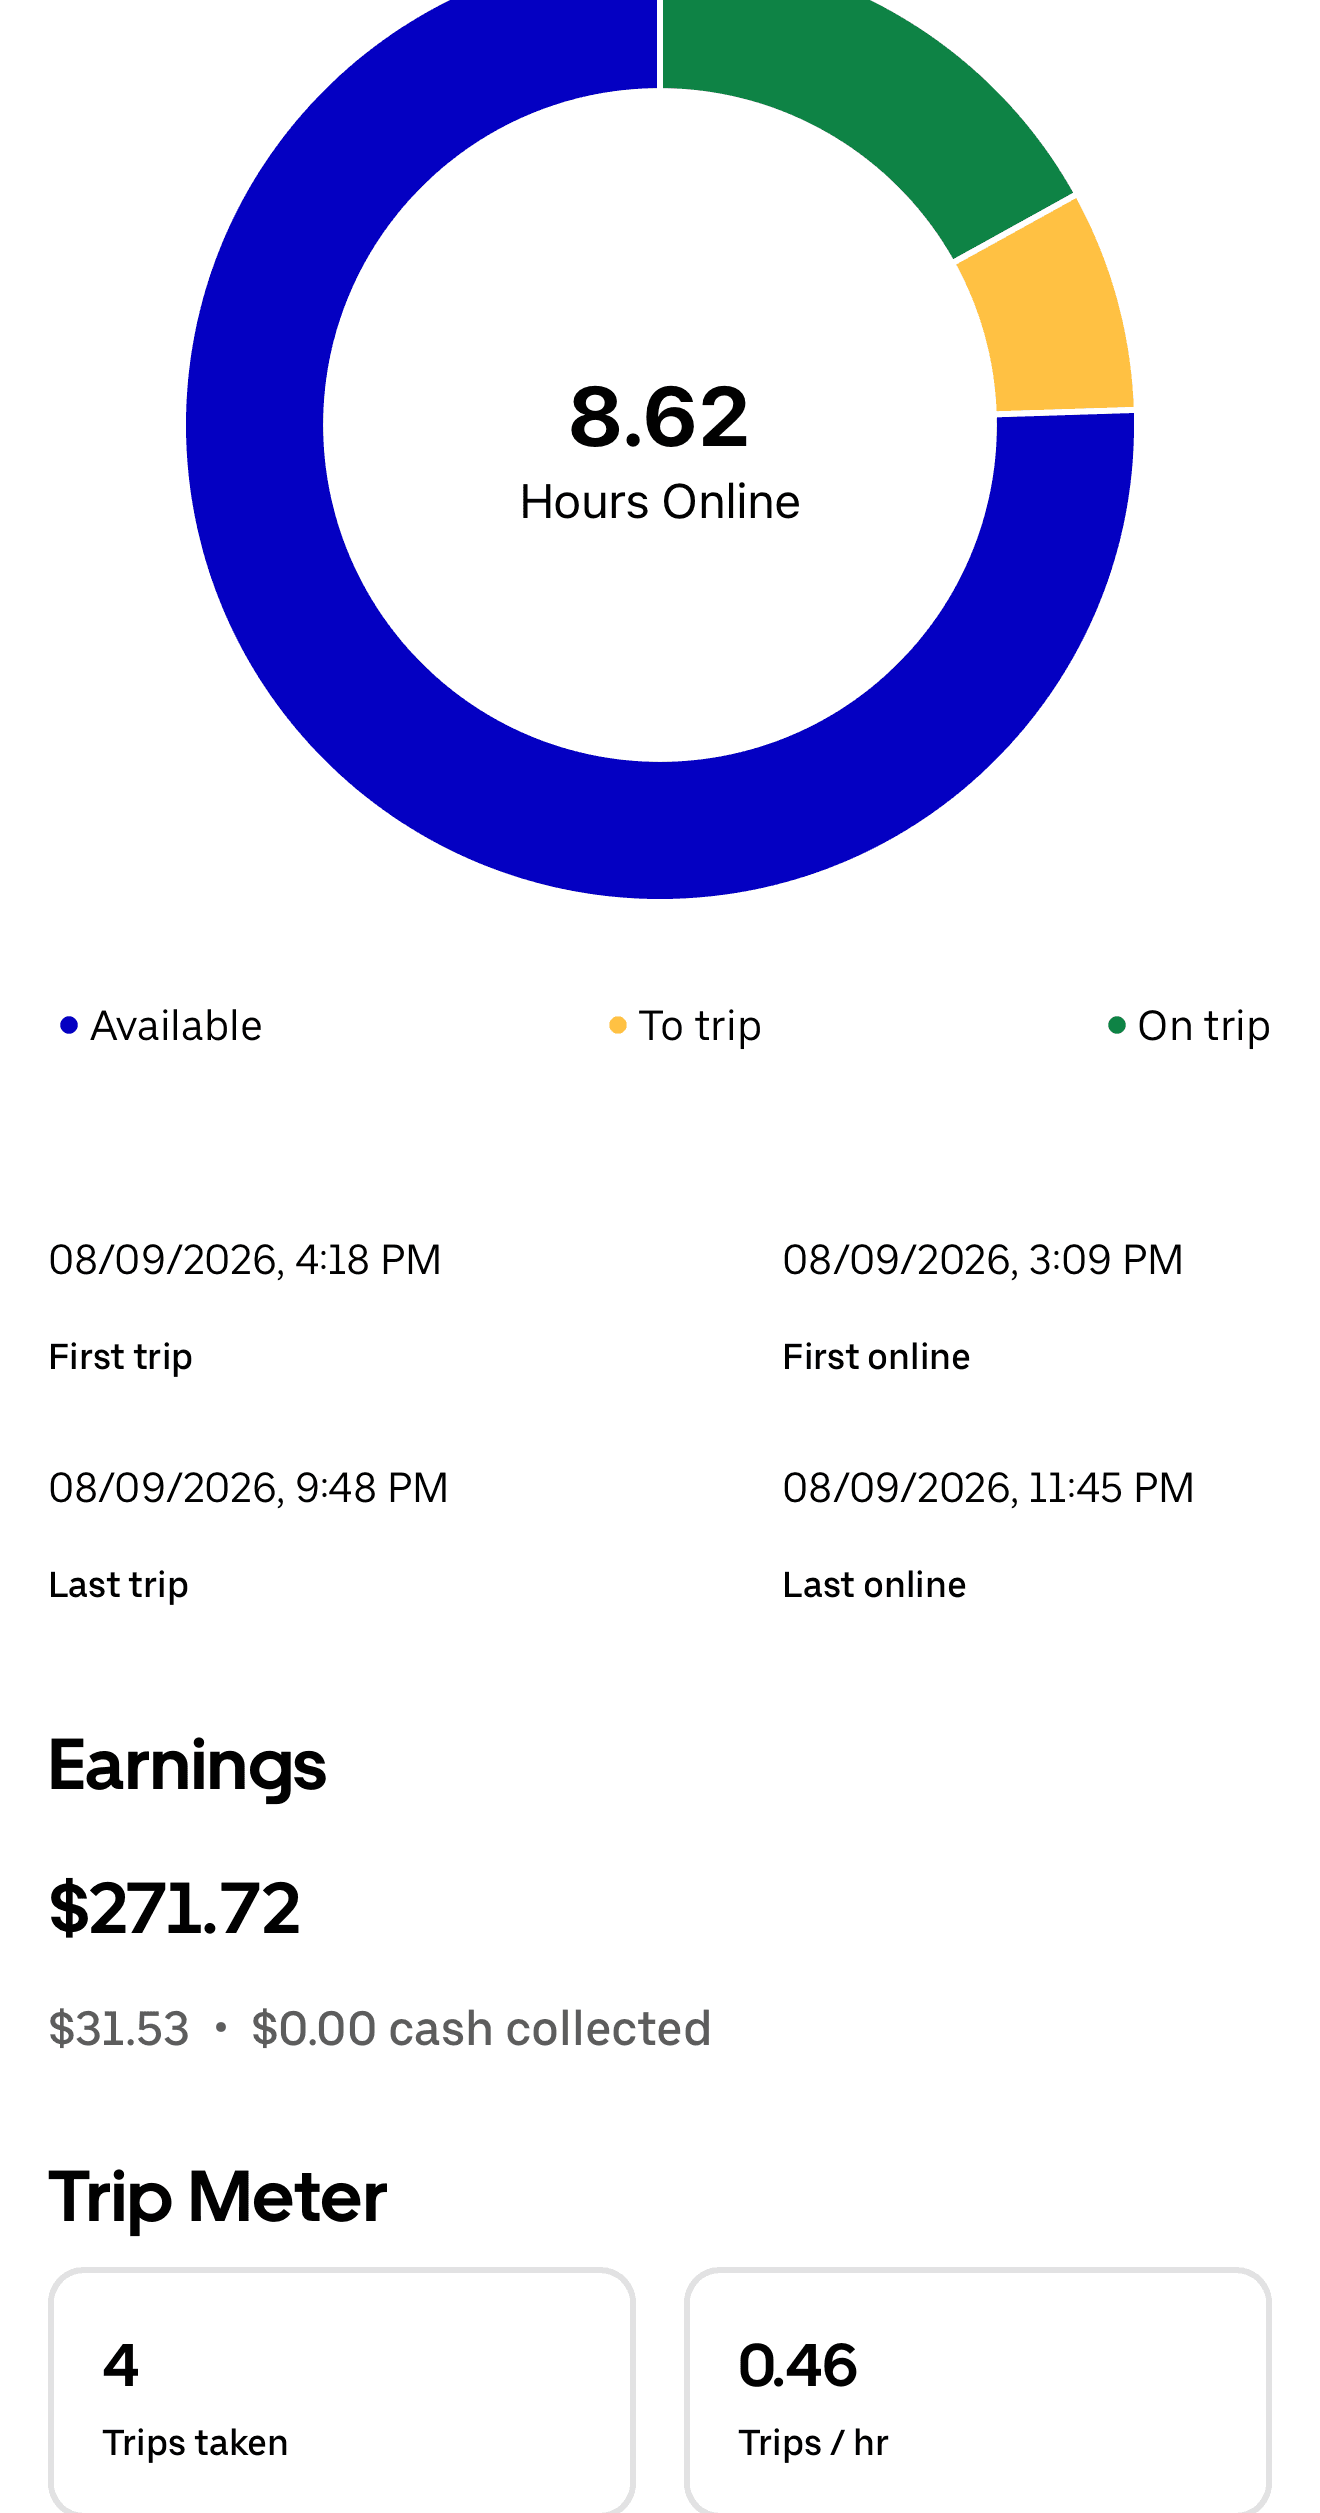
$271.72 – $703.43
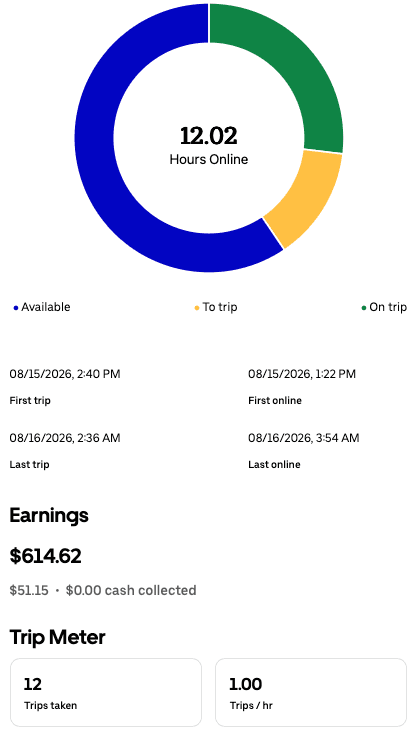
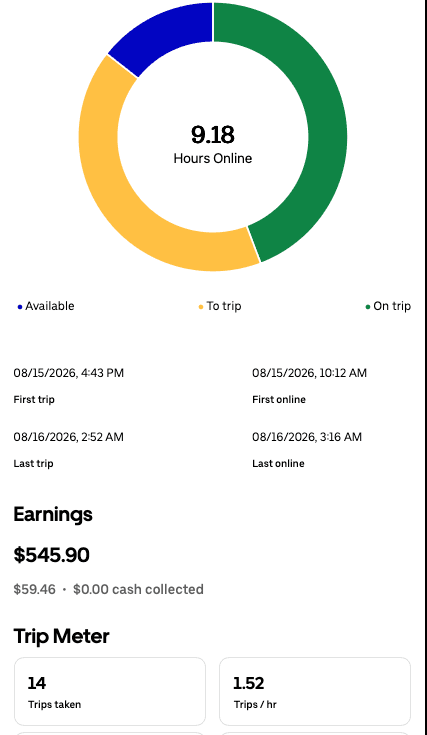
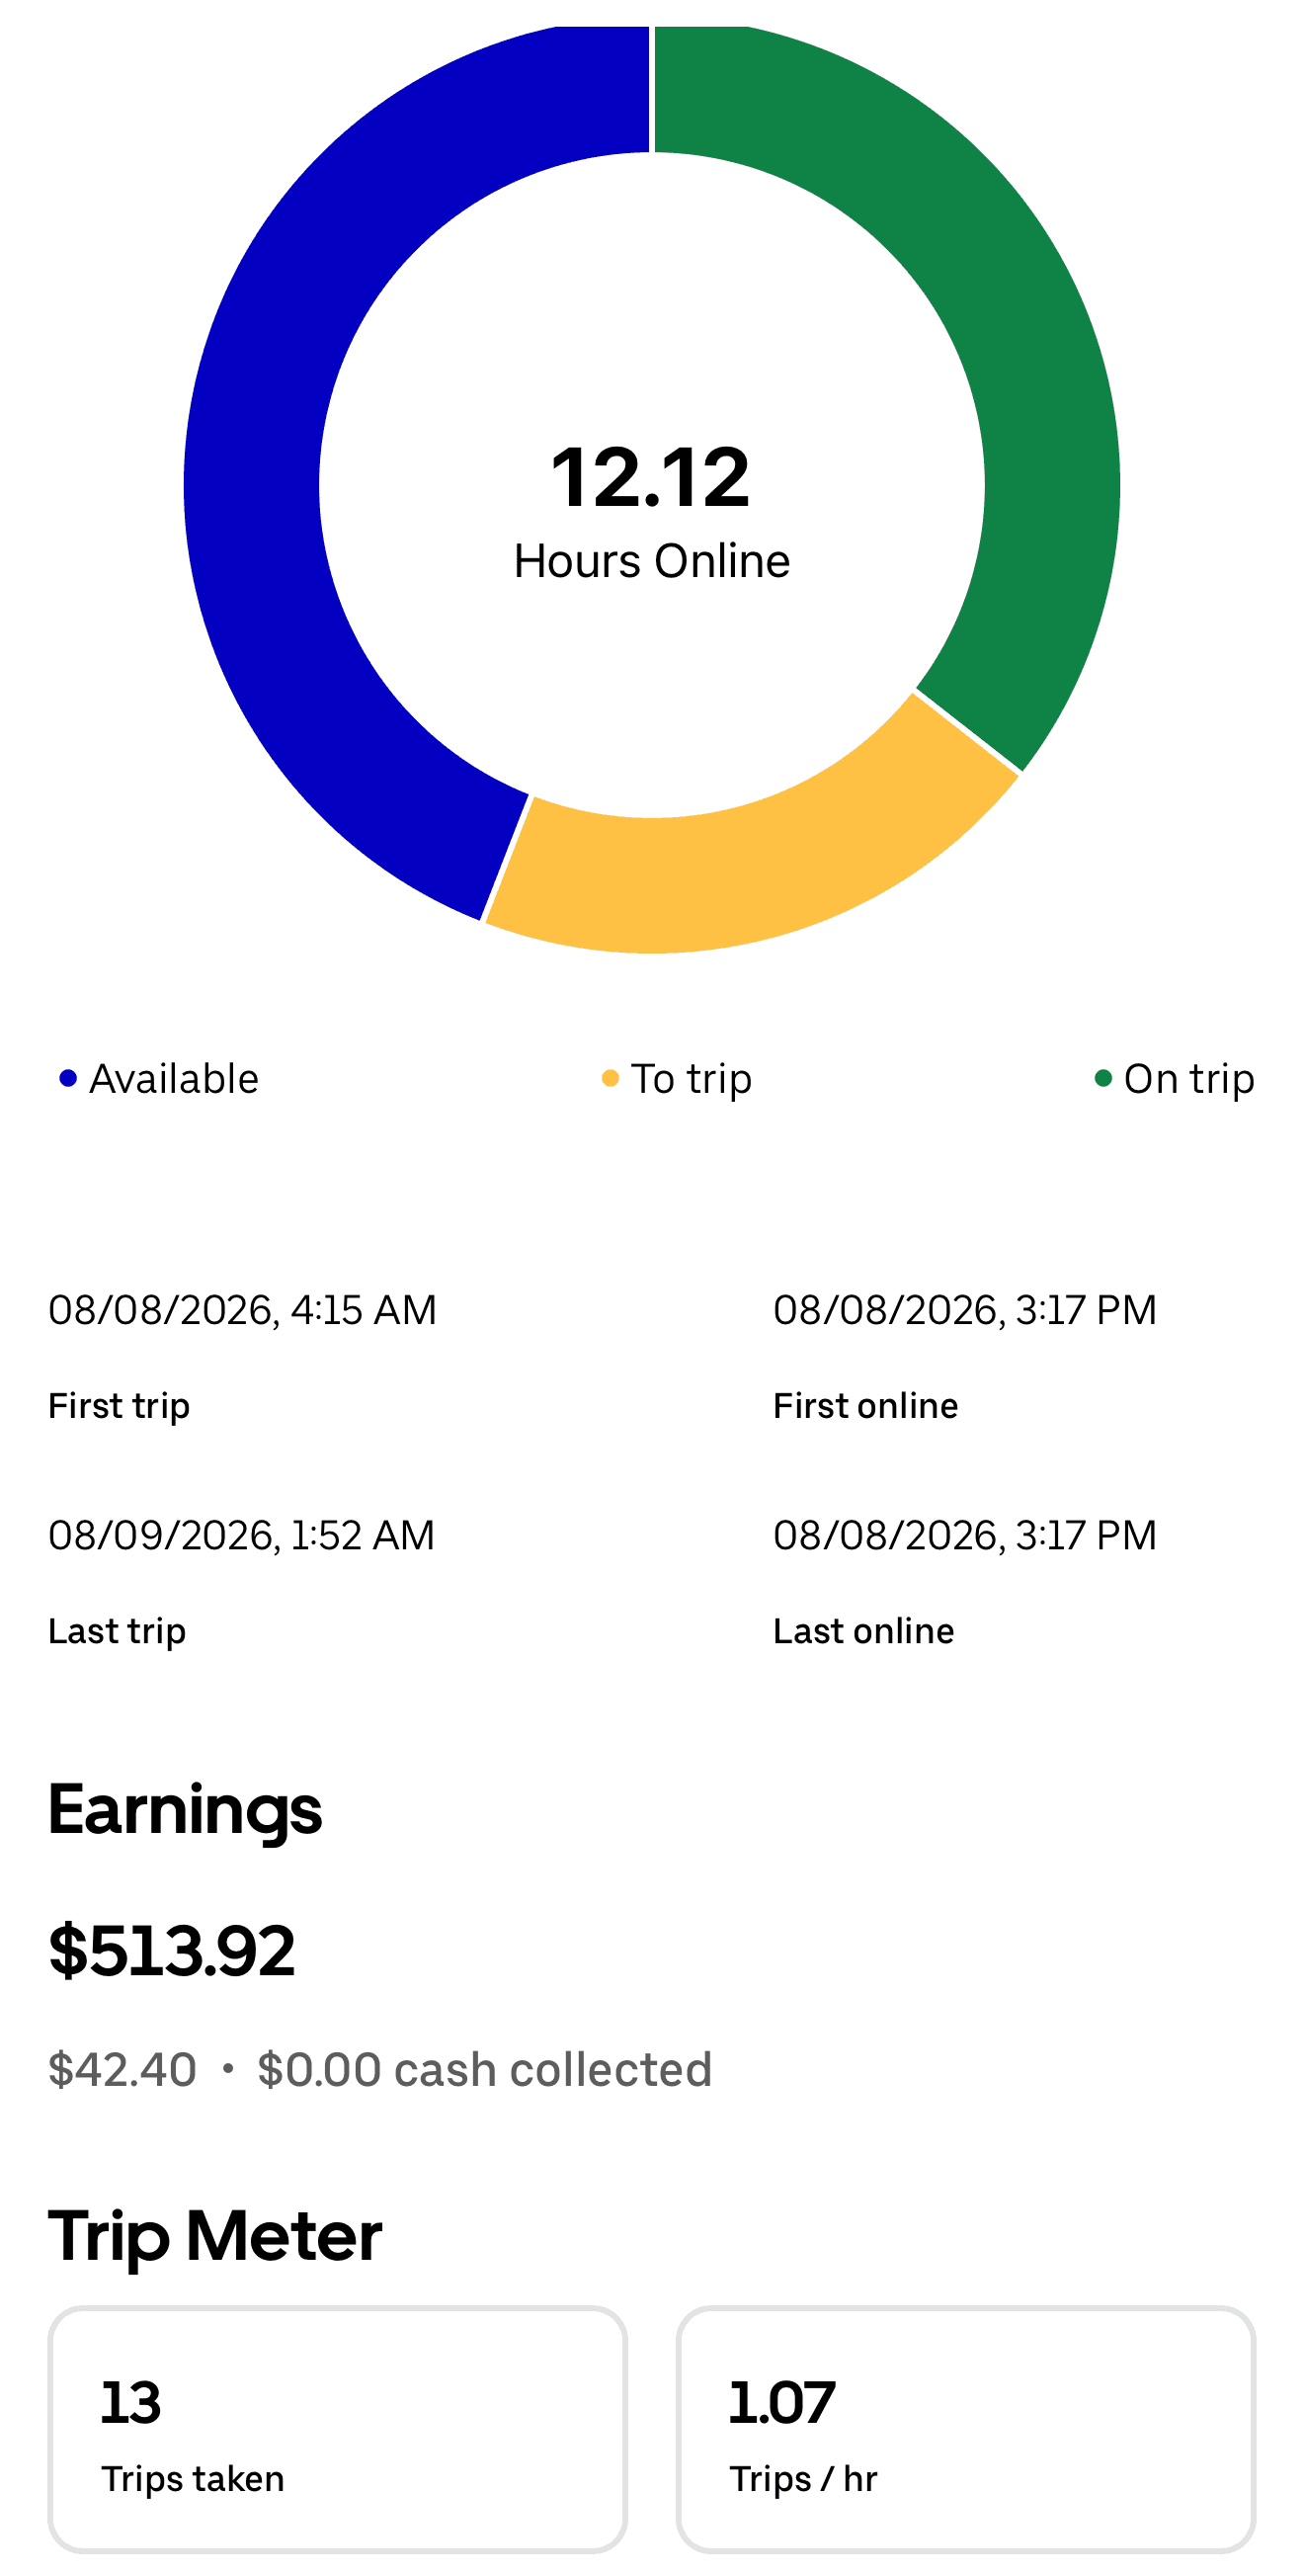
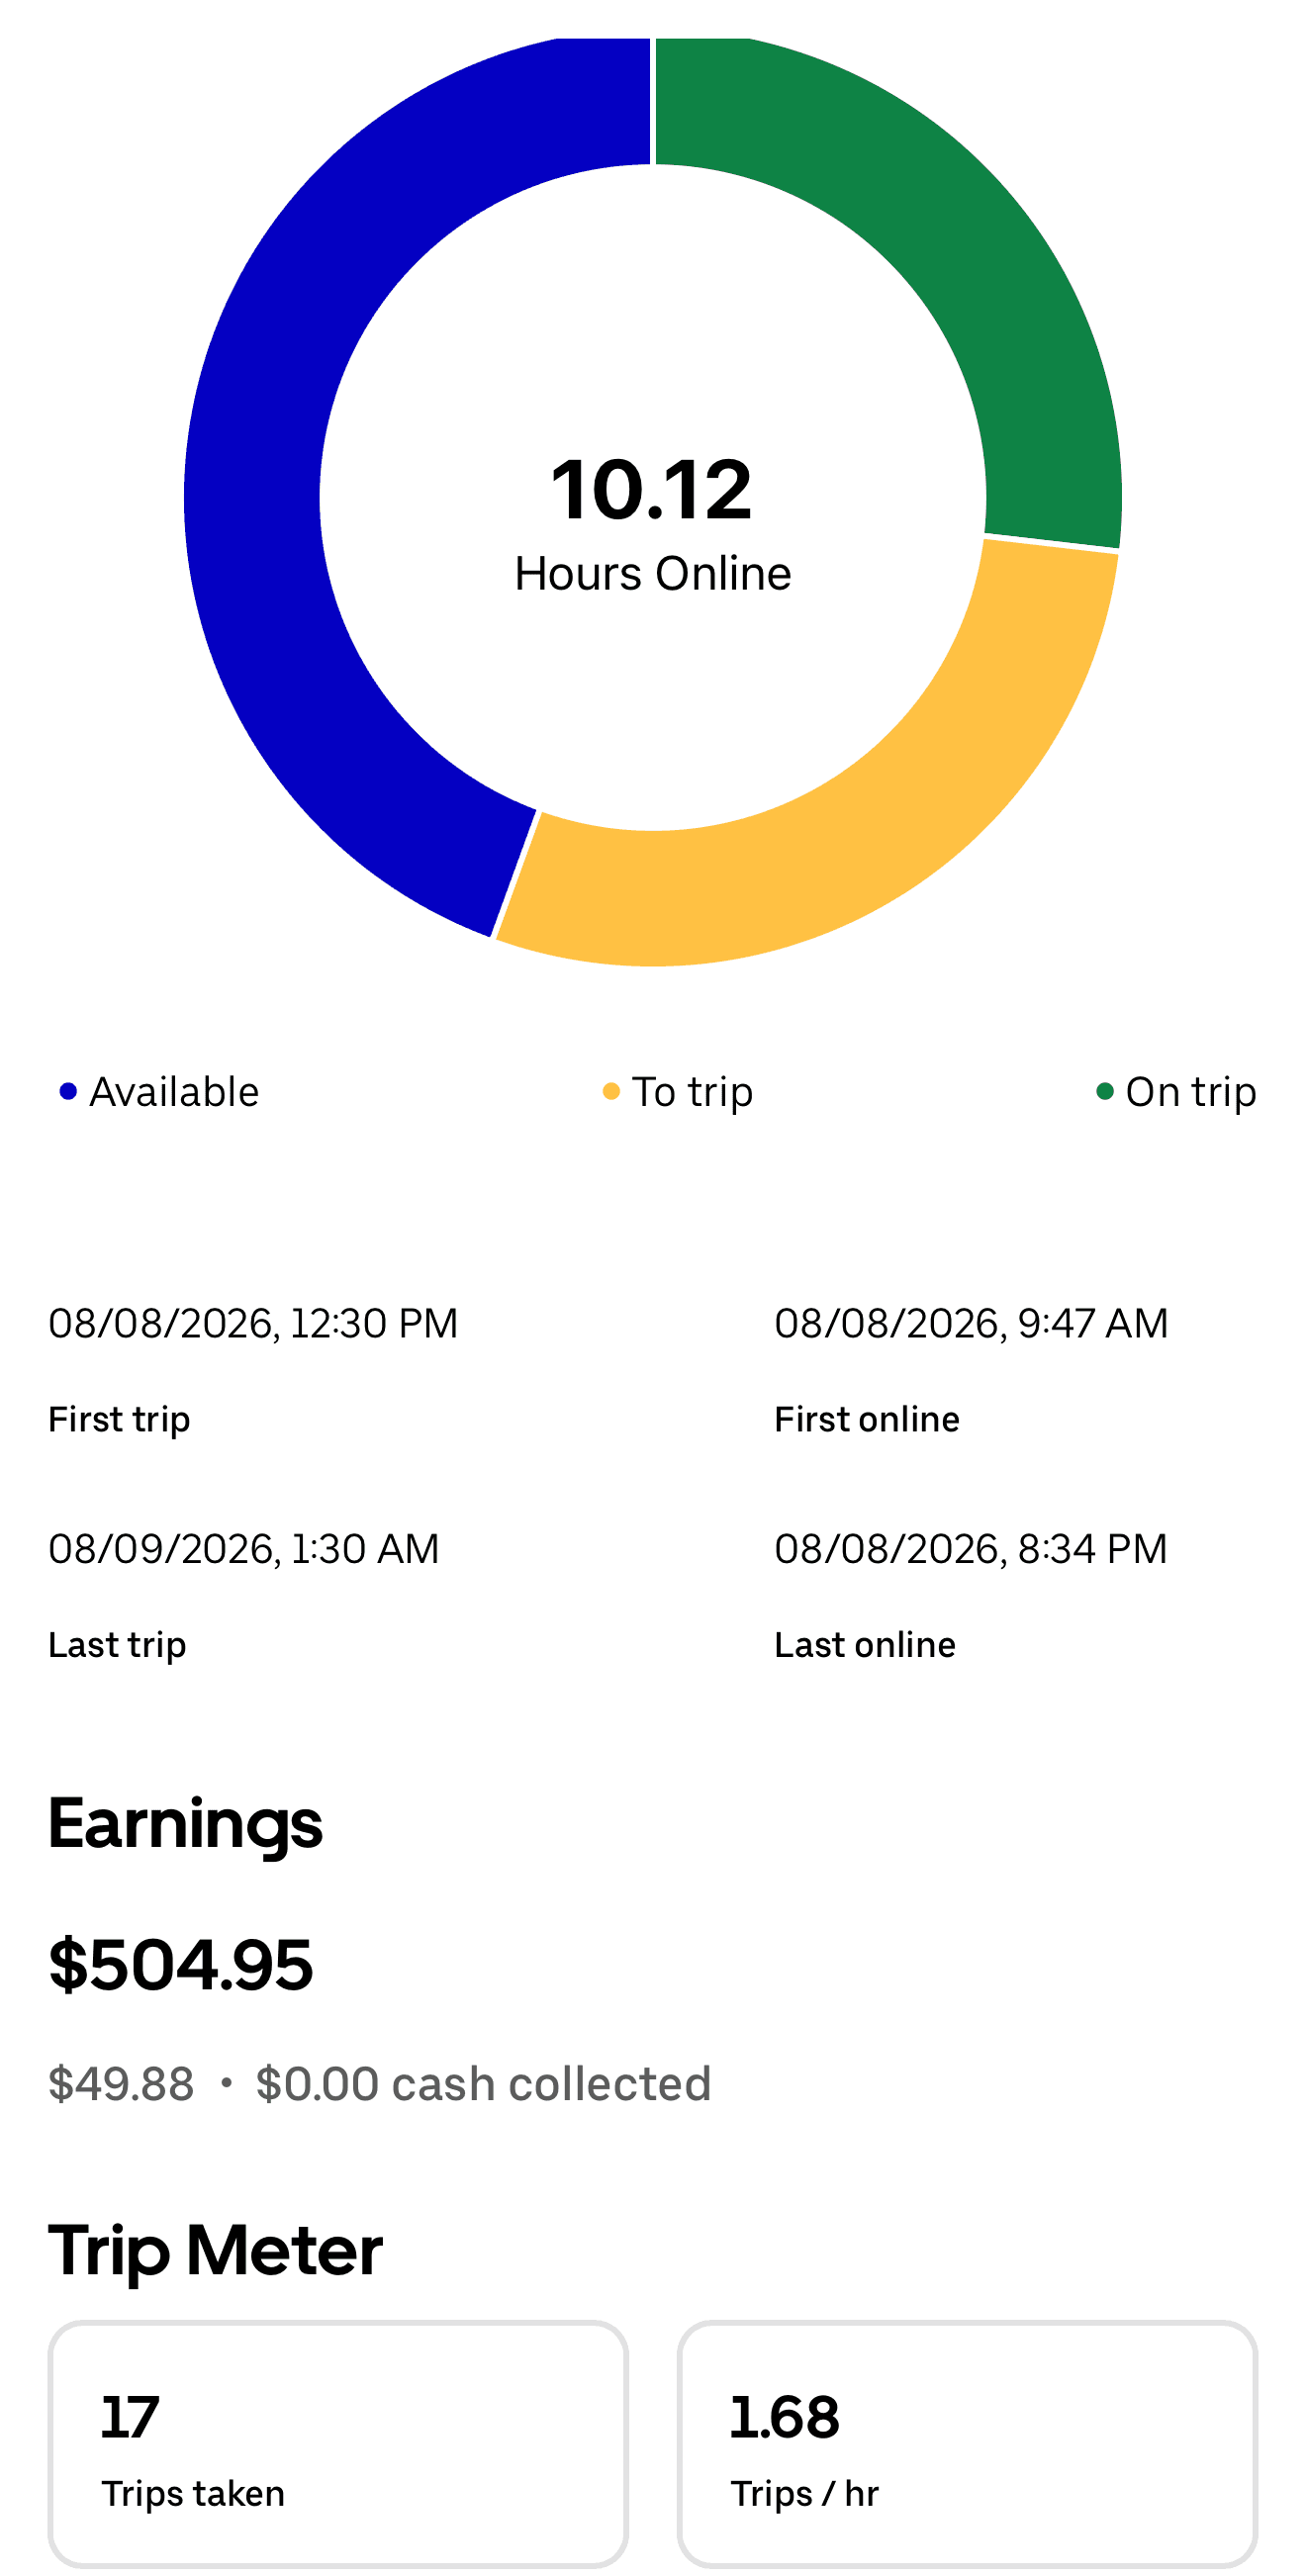
29 single-day screenshots
These are real earnings from real drivers in our fleet — every figure on this page comes from a screenshot a driver sent us, published unedited. They show what is possible, not what is promised. Earnings are not guaranteed. What you make depends on your hours, how many trips you take, how and where you choose to drive, and the conditions in the market that week. These figures are gross, before the weekly rental, fuel and other costs. Full disclosure below.
By the week
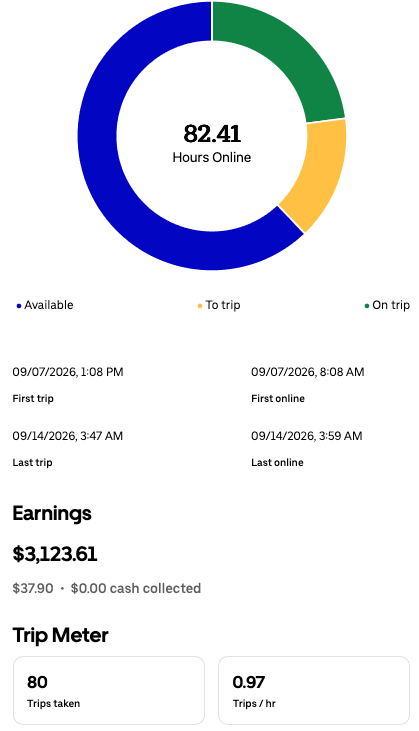
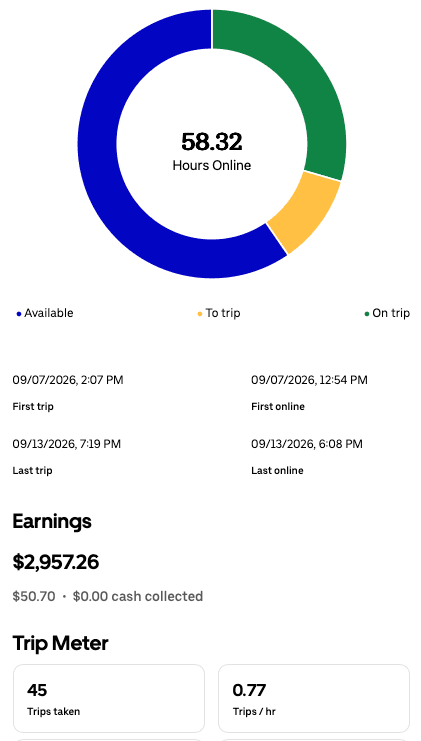
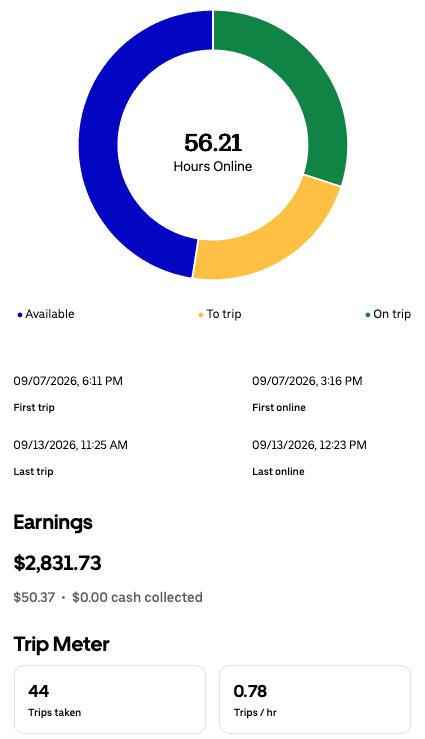
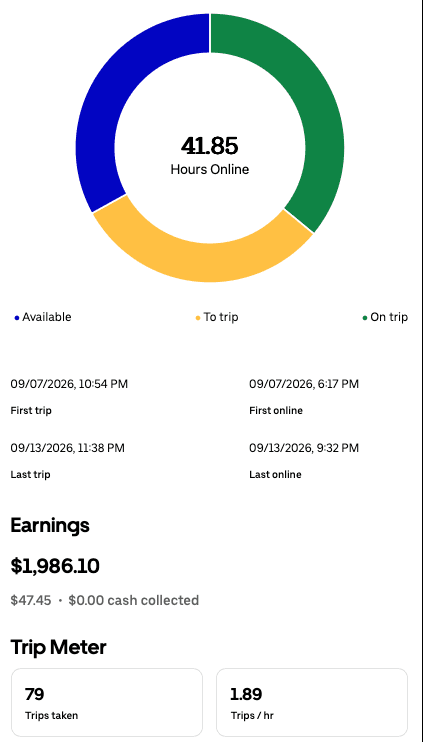
Full-week driver app summaries, newest first. Each screenshot is one driver’s own week.
Week of
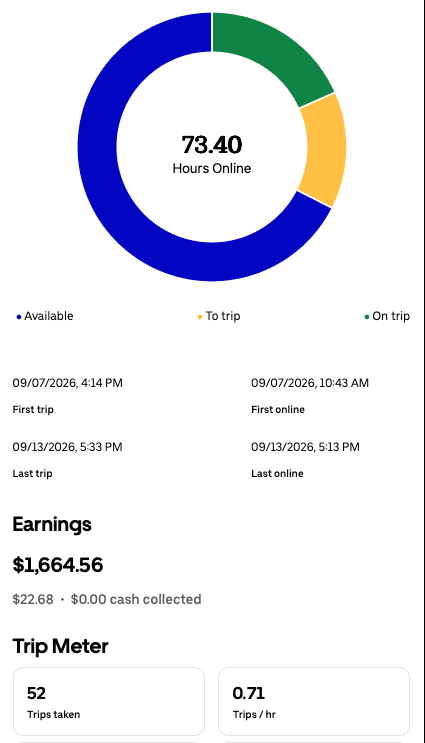
Sep 7 – Sep 14, 2026
This week’s range
$1,664.56 – $3,123.61
5 drivers
Week of
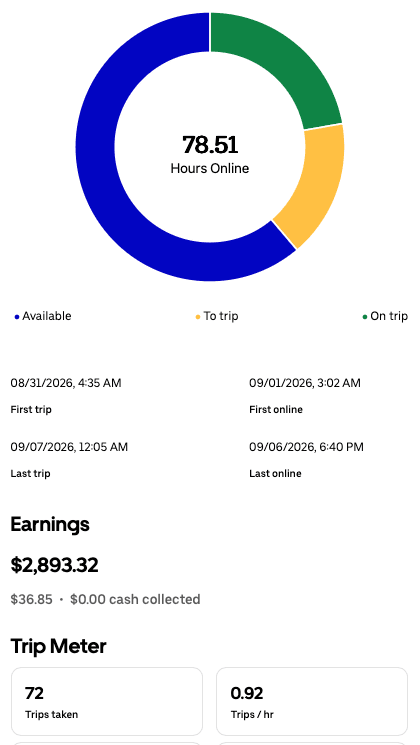
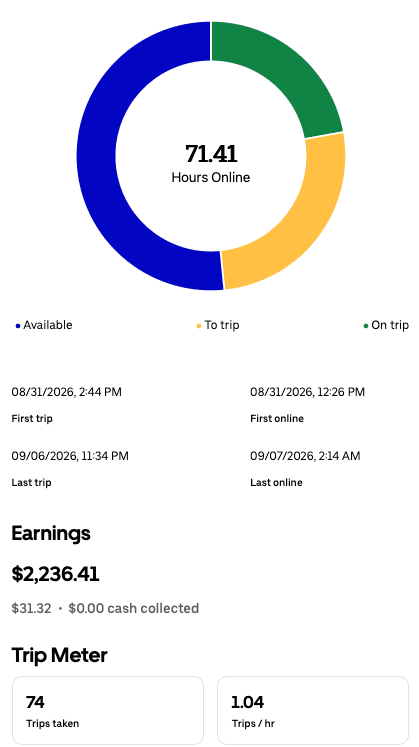
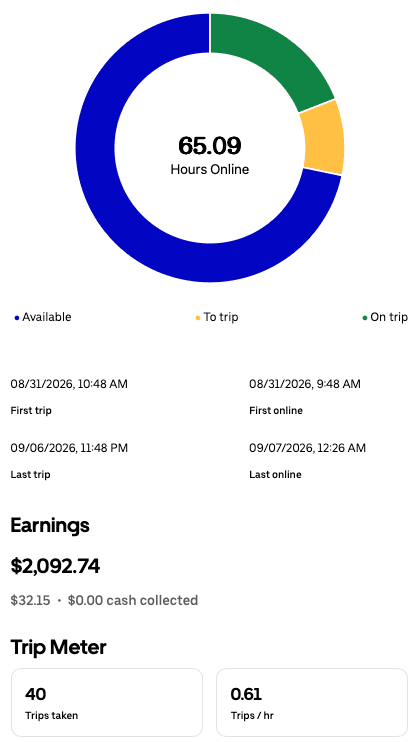
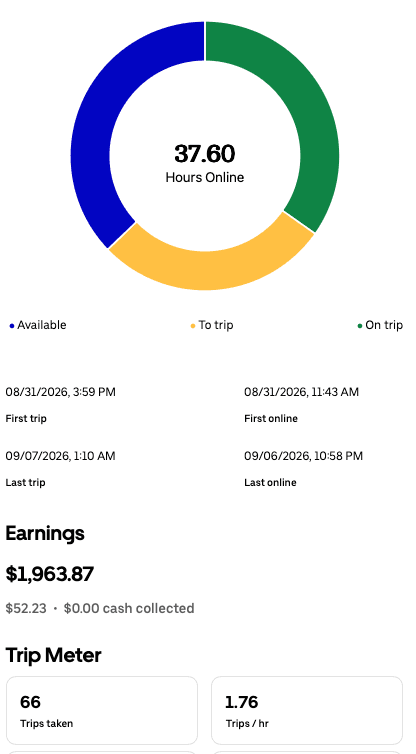
Aug 31 – Sep 7, 2026
This week’s range
$1,963.87 – $2,893.32
4 drivers
Week of
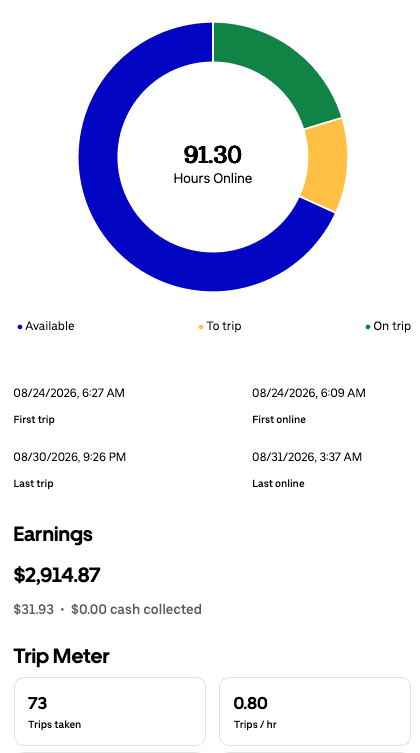
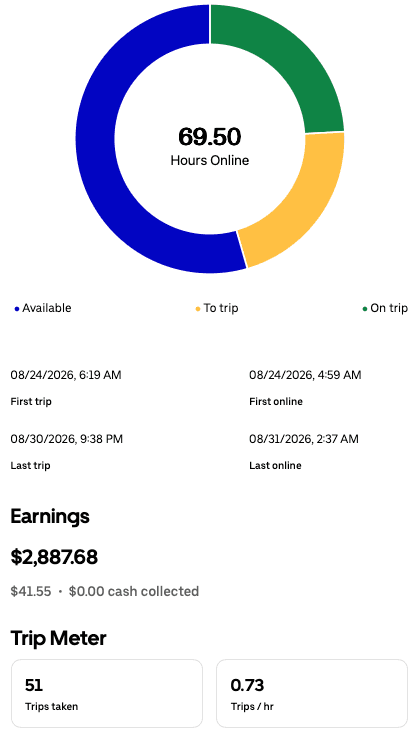
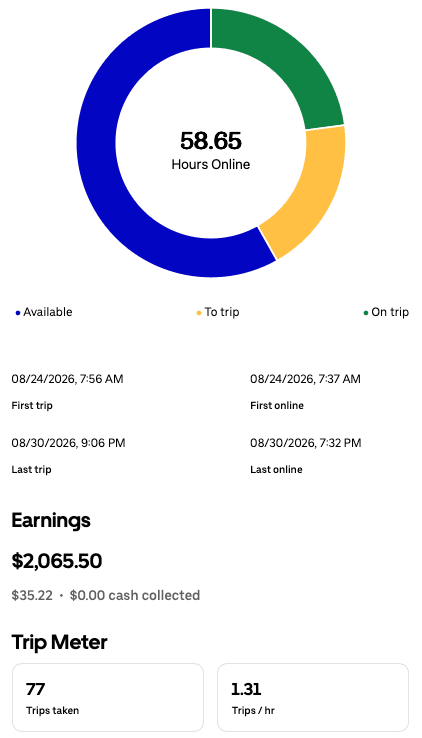
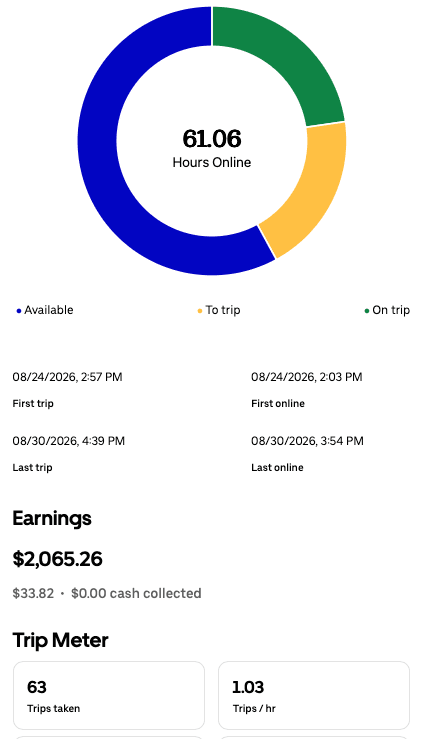
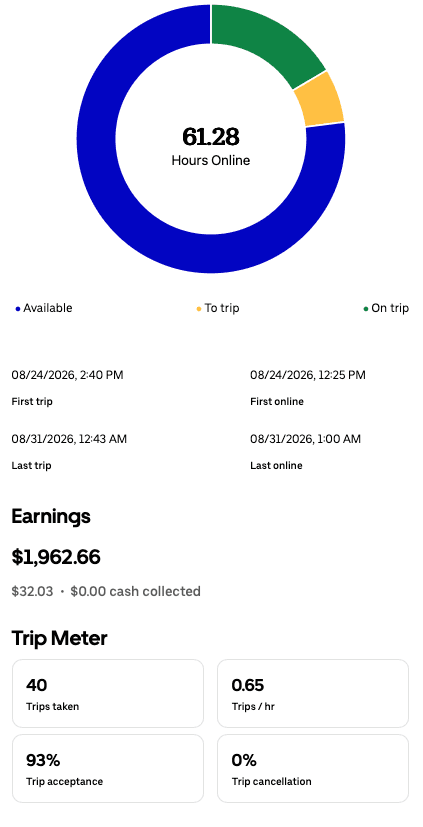
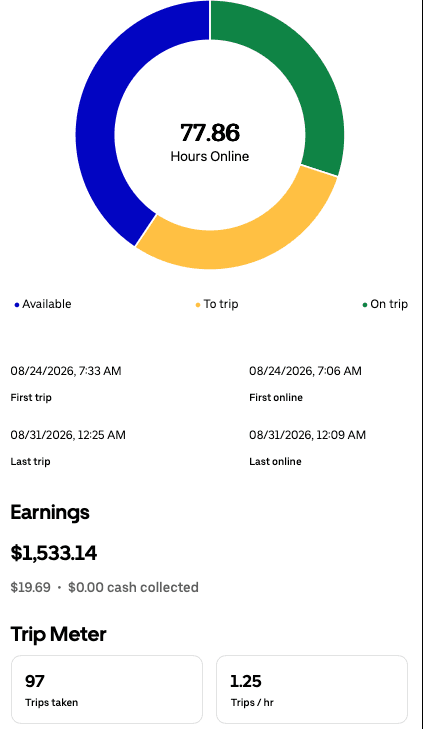
Aug 24 – Aug 31, 2026
This week’s range
$1,533.14 – $2,914.87
6 drivers
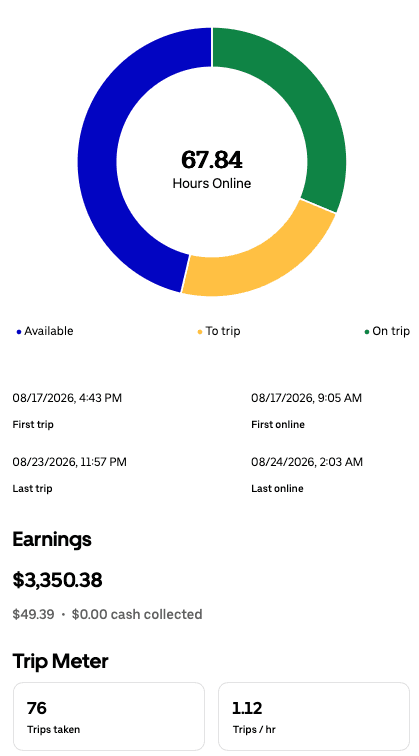
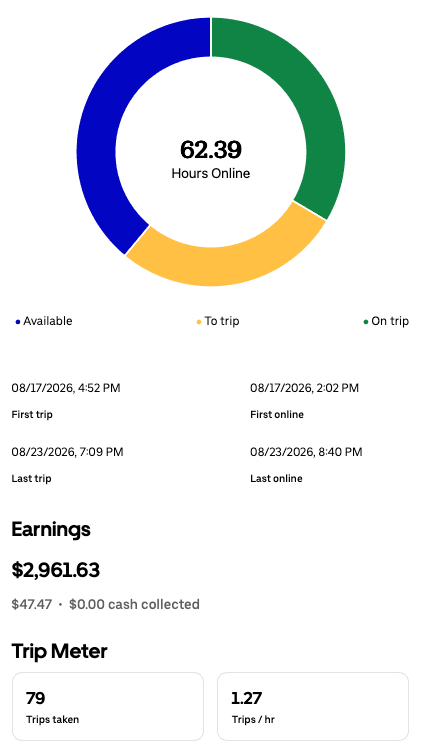
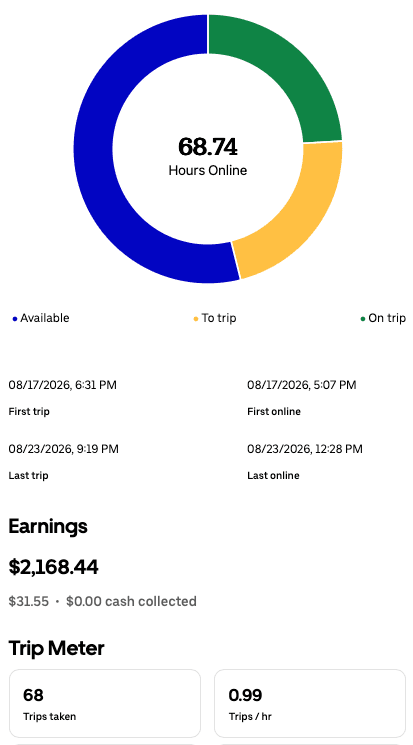
Week of
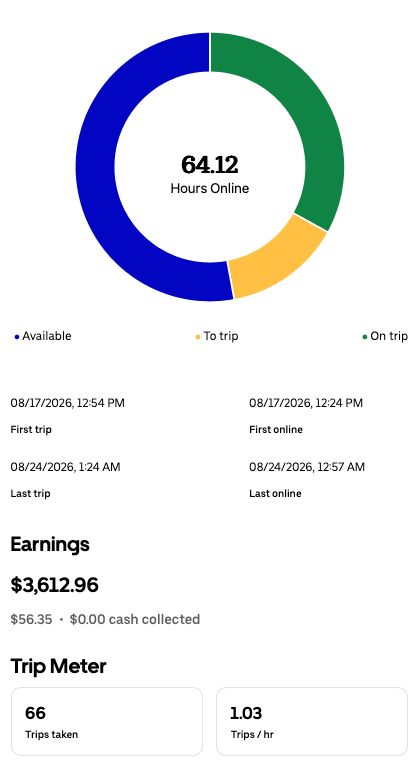
Aug 17 – Aug 24, 2026
This week’s range
$2,168.44 – $3,612.96
4 drivers
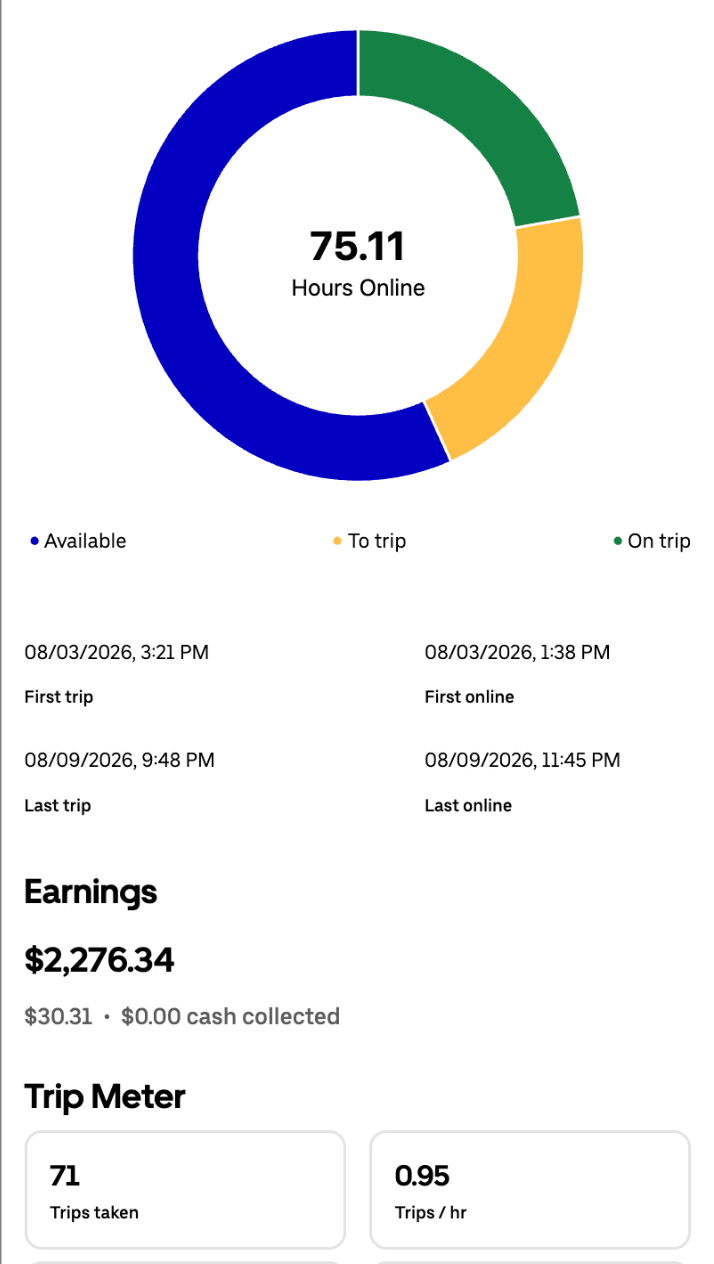
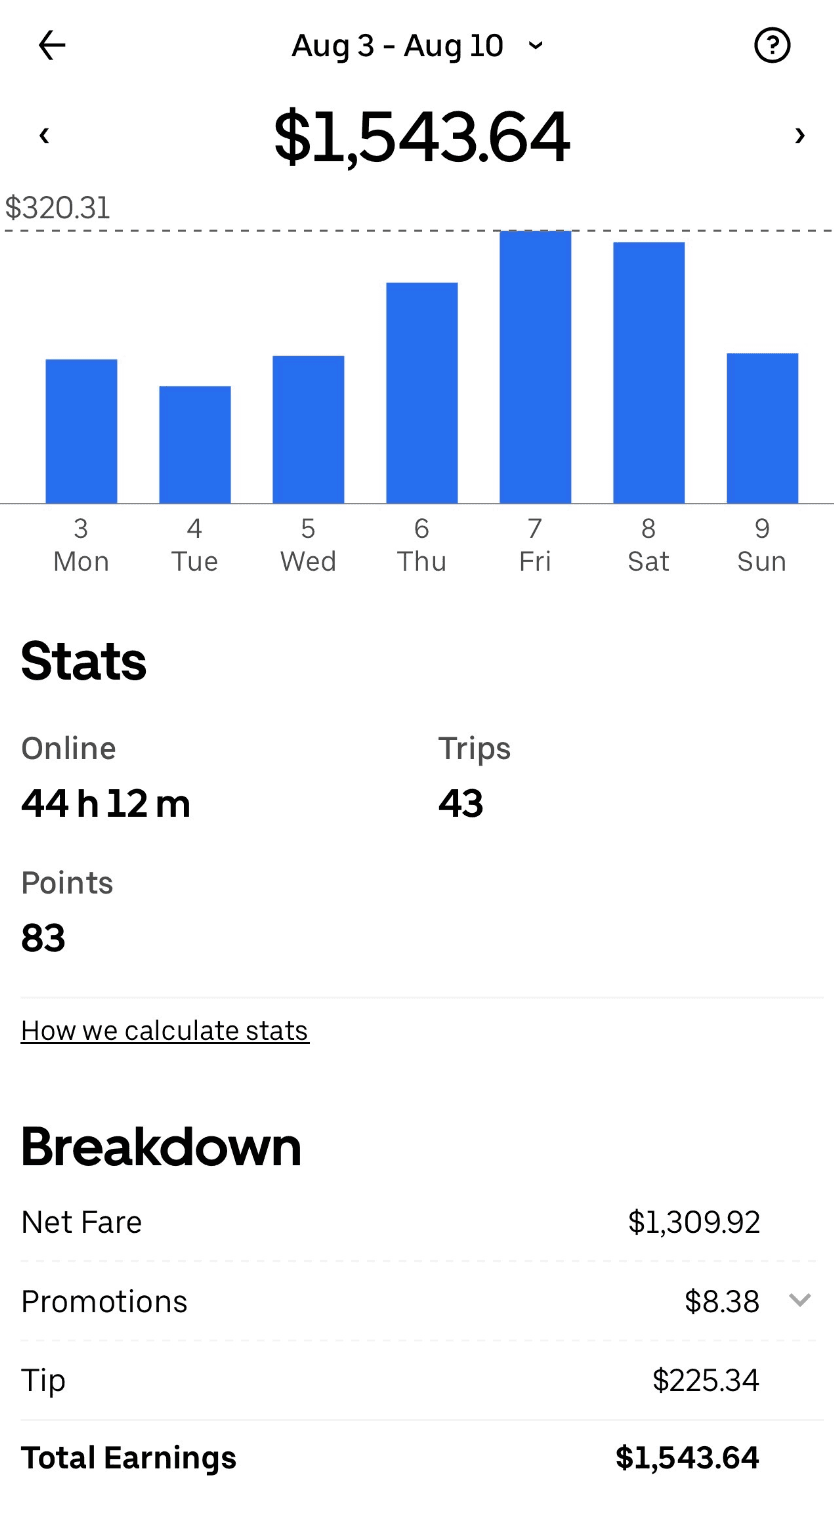
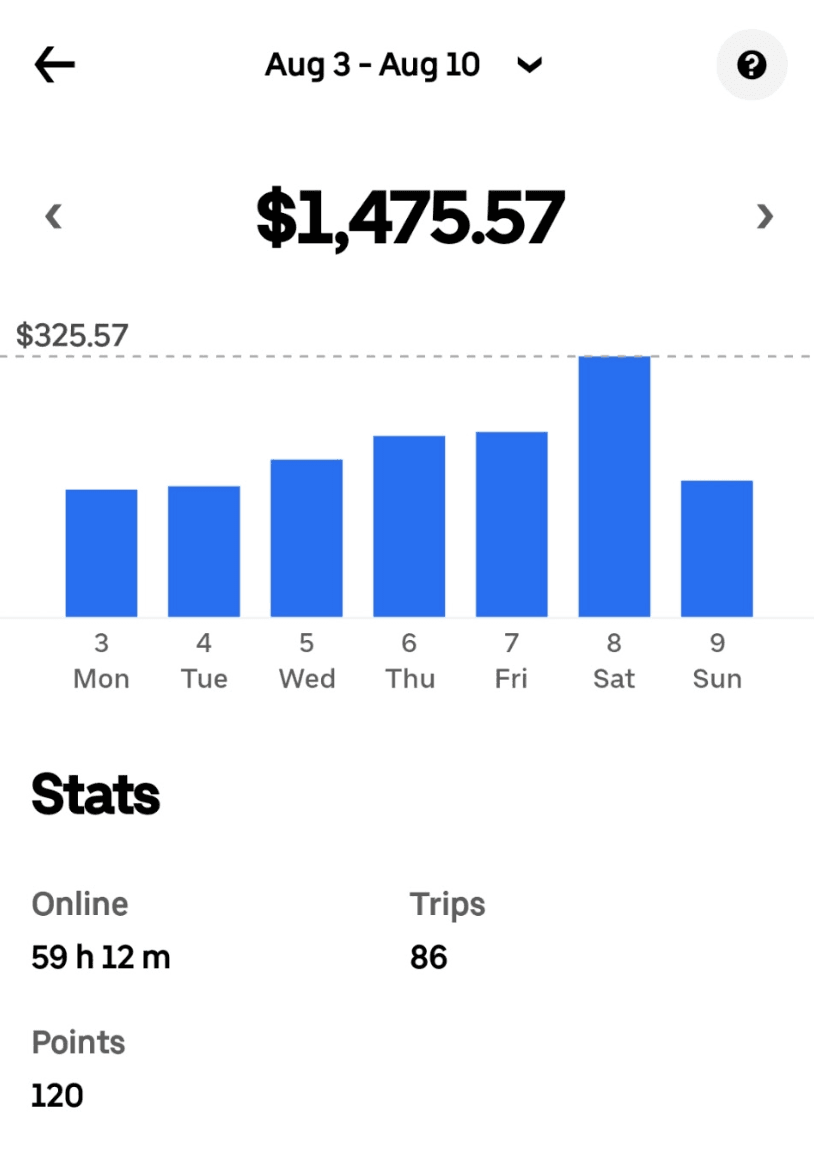
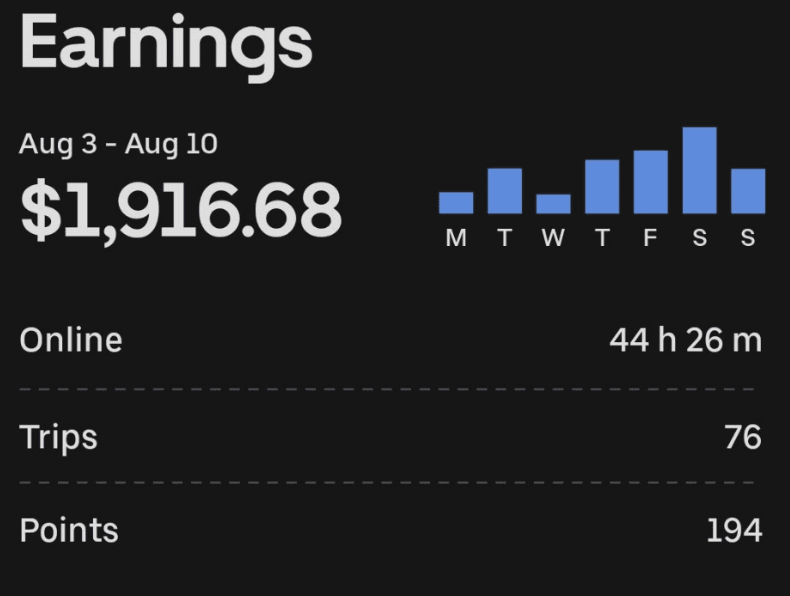
Week of
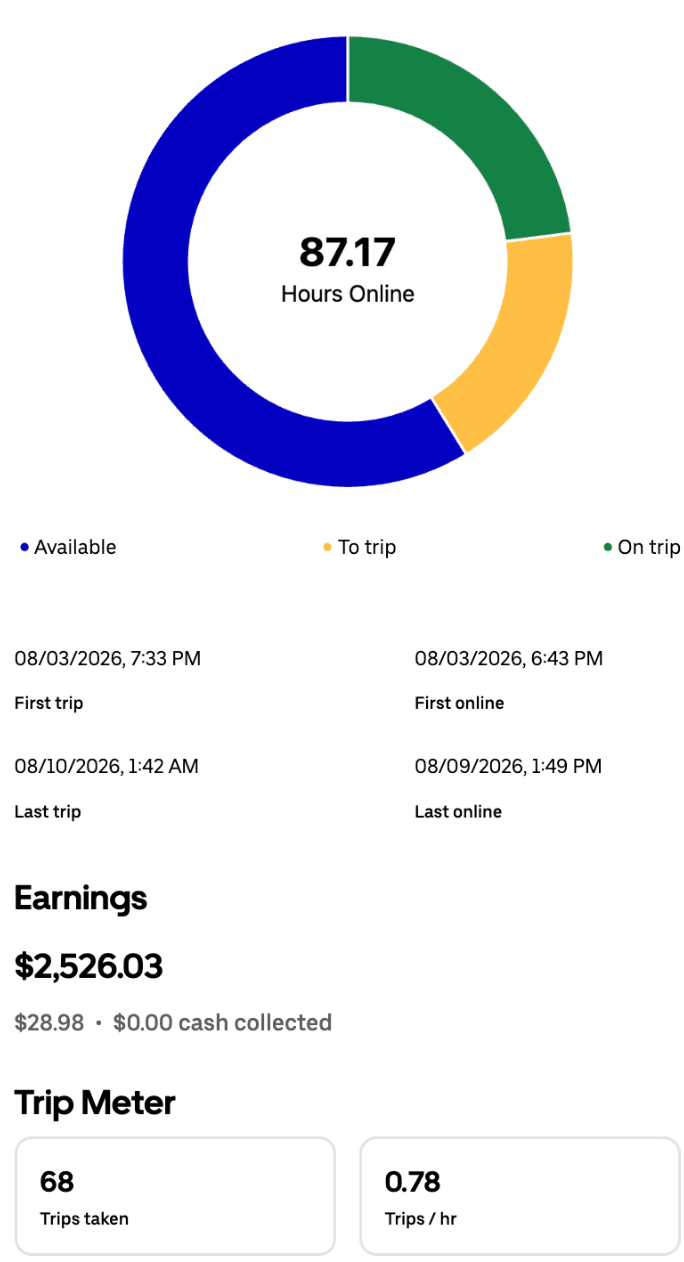
Aug 3 – Aug 10, 2026
This week’s range
$1,475.57 – $2,526.03
5 drivers
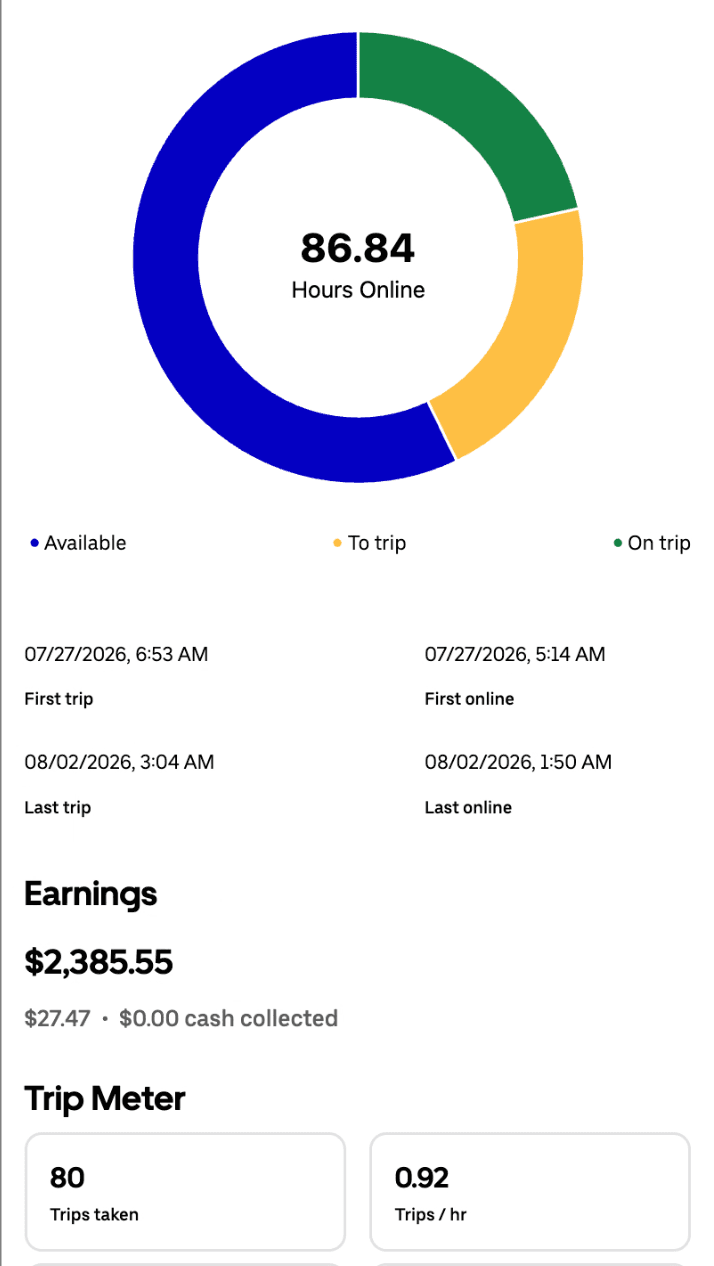
Week of
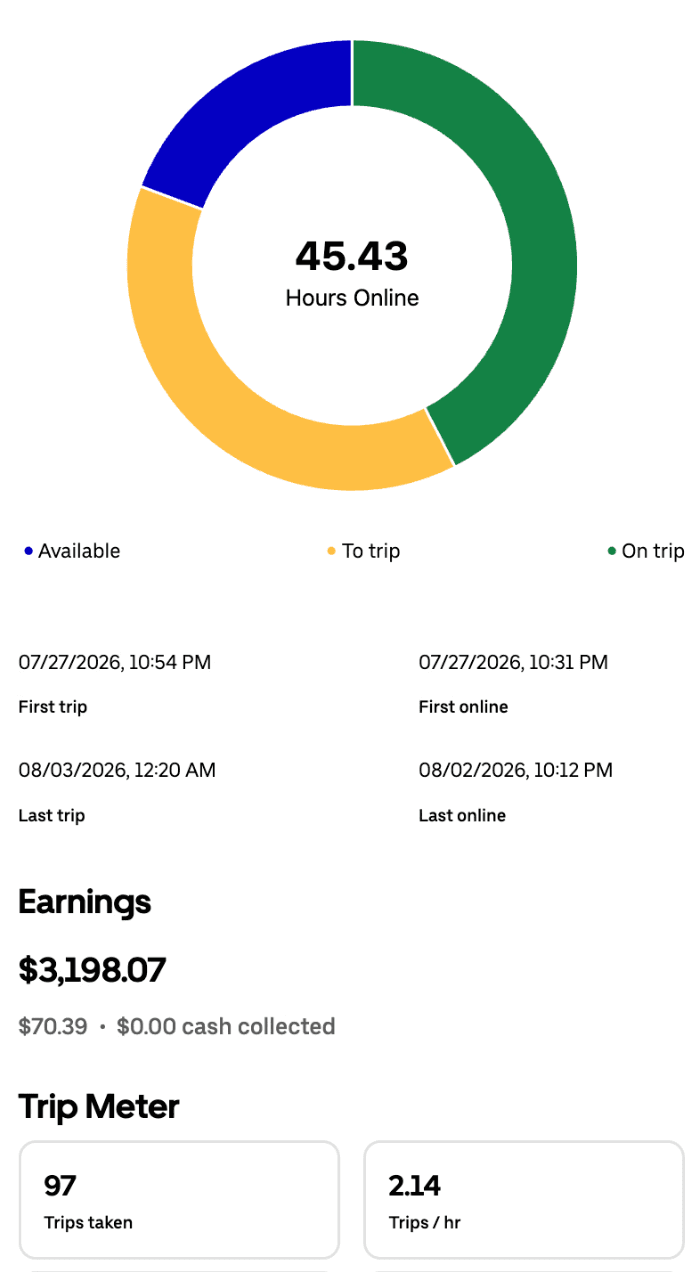
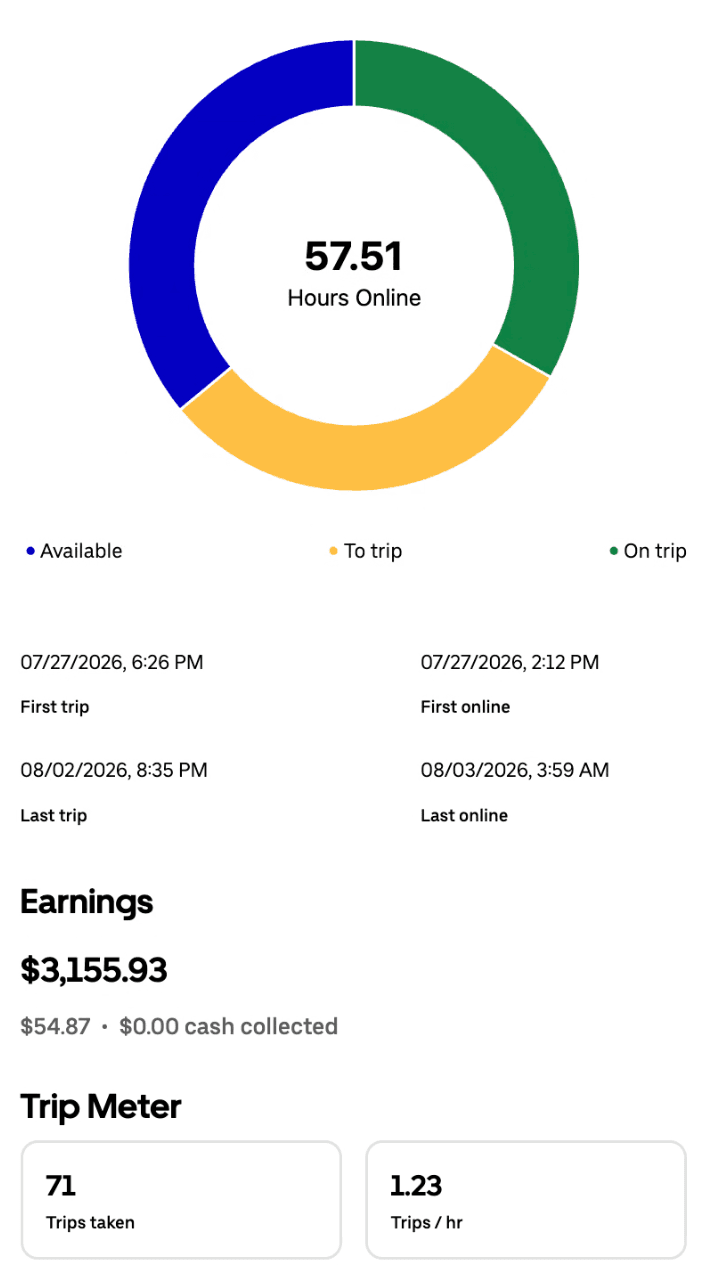
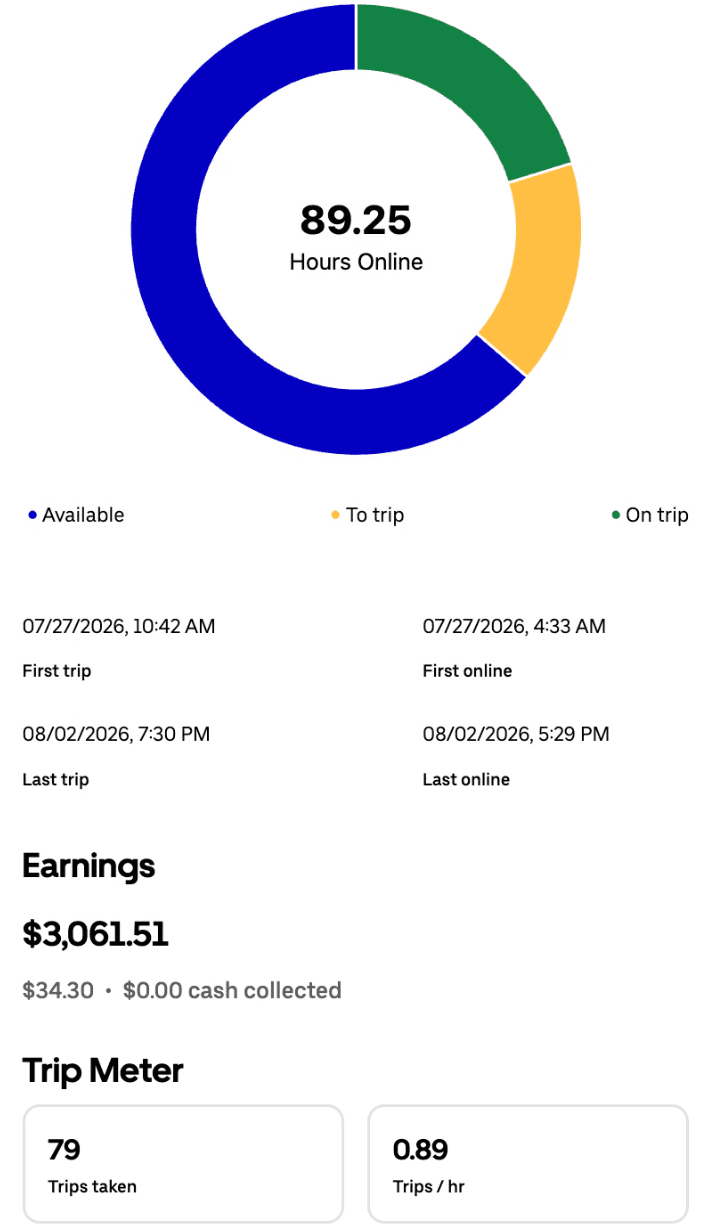
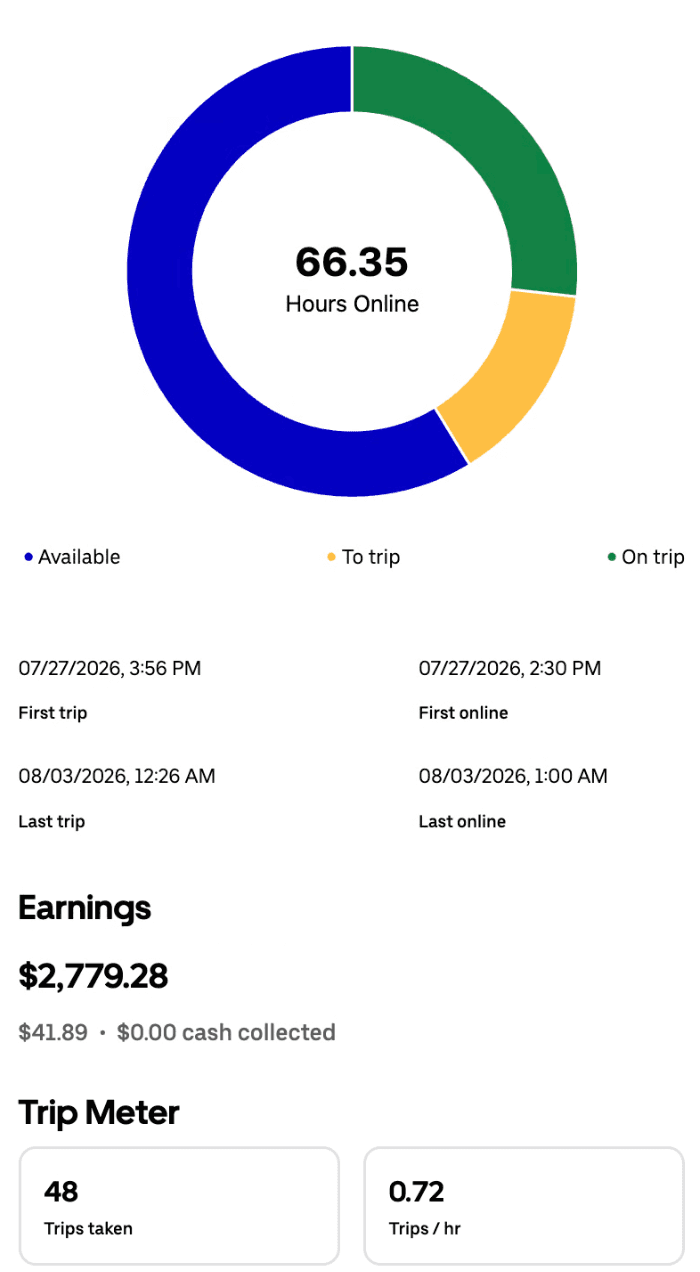
Jul 27 – Aug 3, 2026
This week’s range
$2,385.55 – $3,198.07
5 drivers
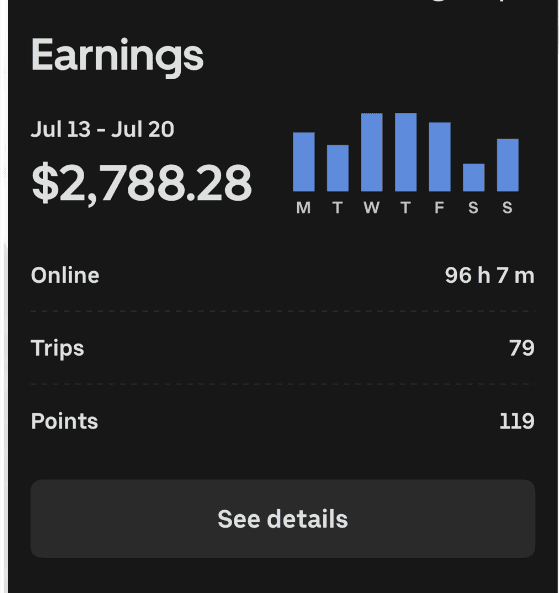
Week of
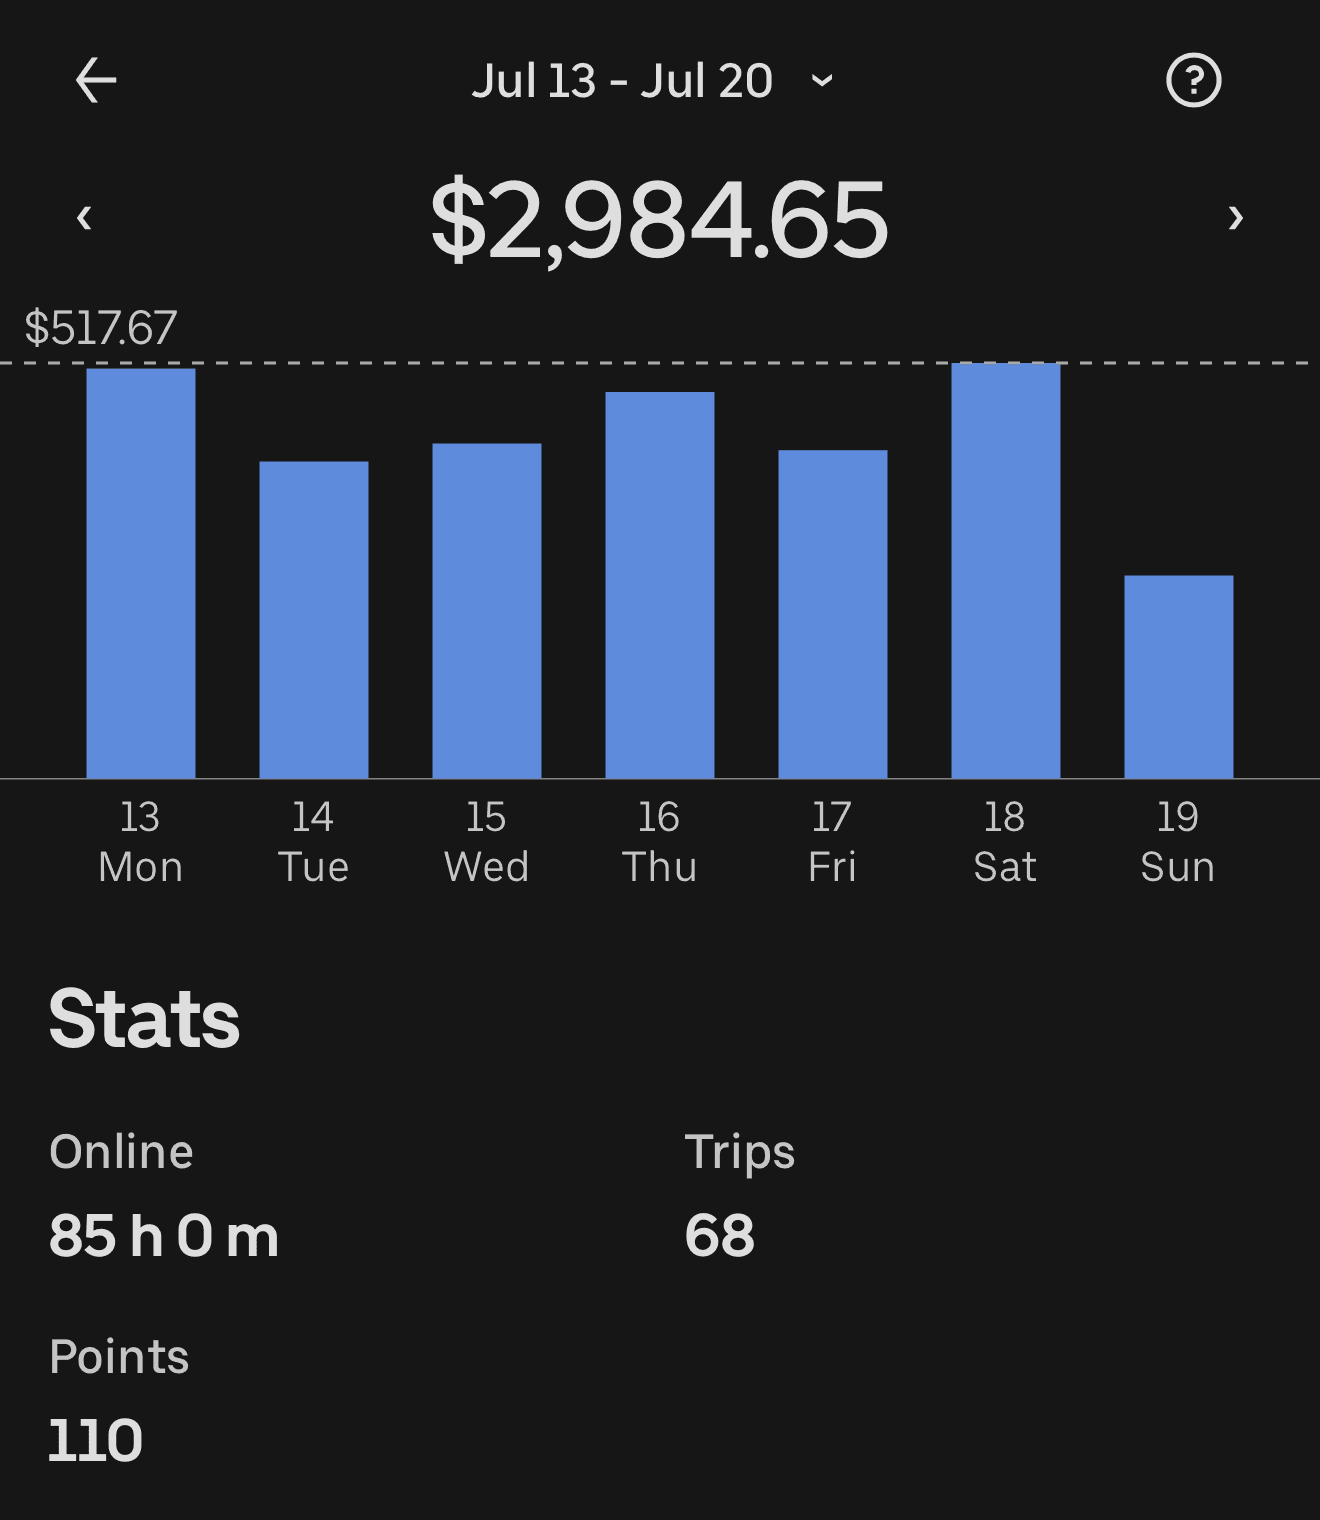
Jul 13 – Jul 20, 2026
This week’s range
$2,788.28 – $2,984.65
2 drivers
Week of
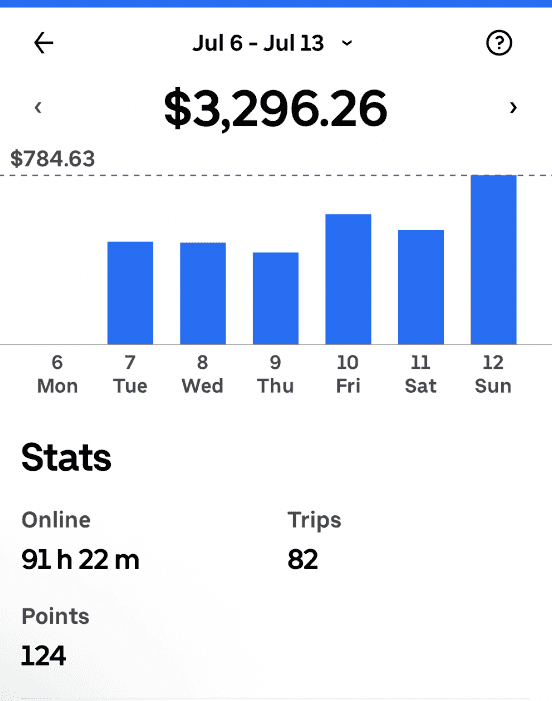
Jul 6 – Jul 13, 2026
This week’s range
$3,296.26
1 driver
Week of
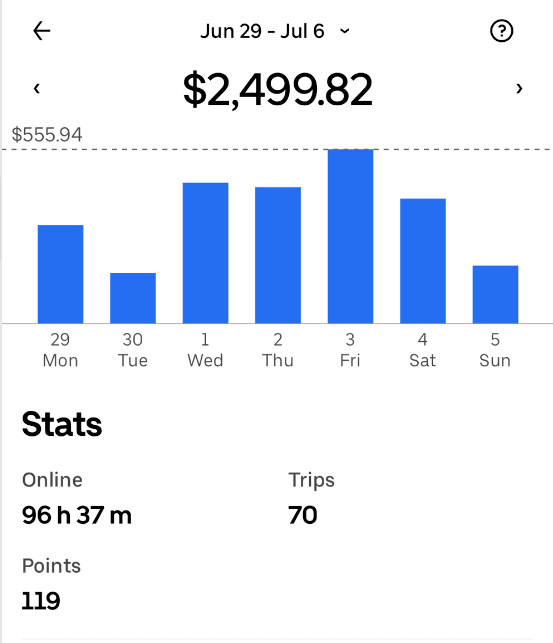
Jun 29 – Jul 6, 2026
This week’s range
$2,499.82
1 driver
Week of
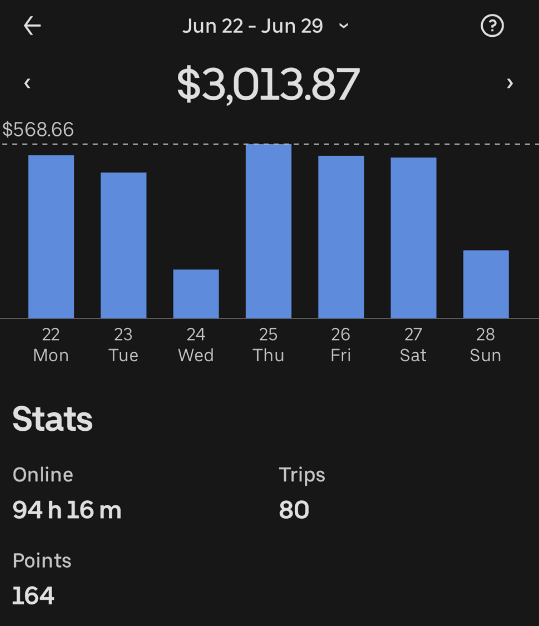
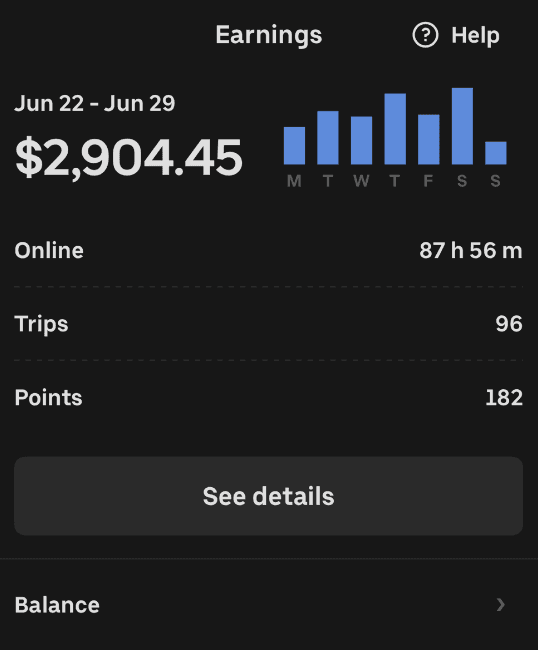
Jun 22 – Jun 29, 2026
This week’s range
$2,904.45 – $3,013.87
2 drivers
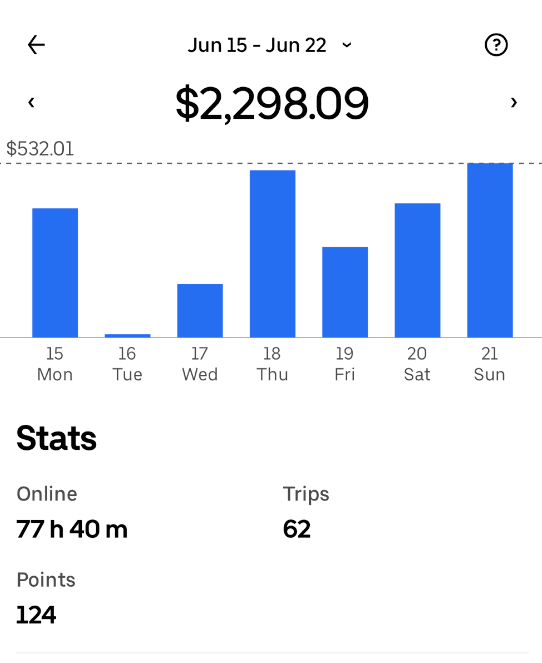
Week of
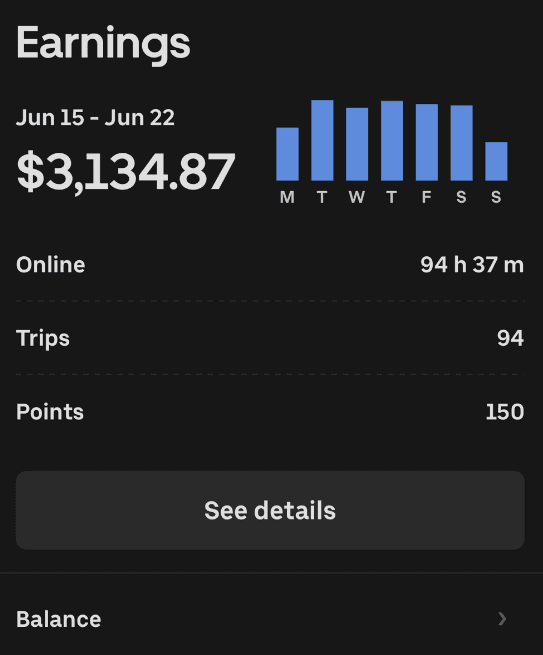
Jun 15 – Jun 22, 2026
This week’s range
$2,298.09 – $3,134.87
2 drivers
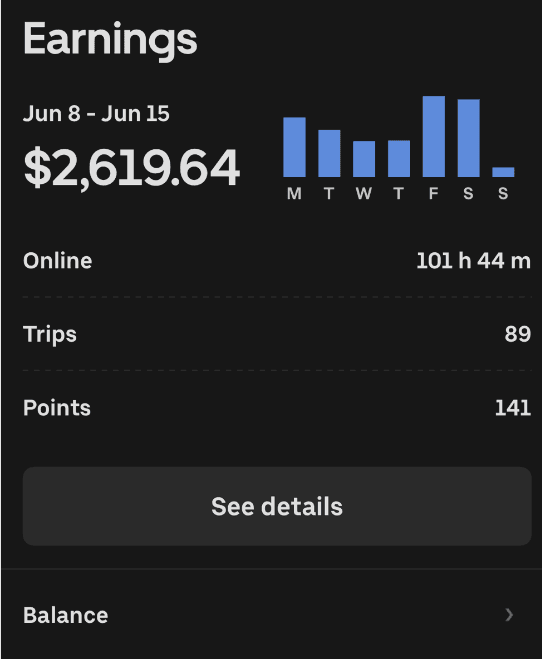
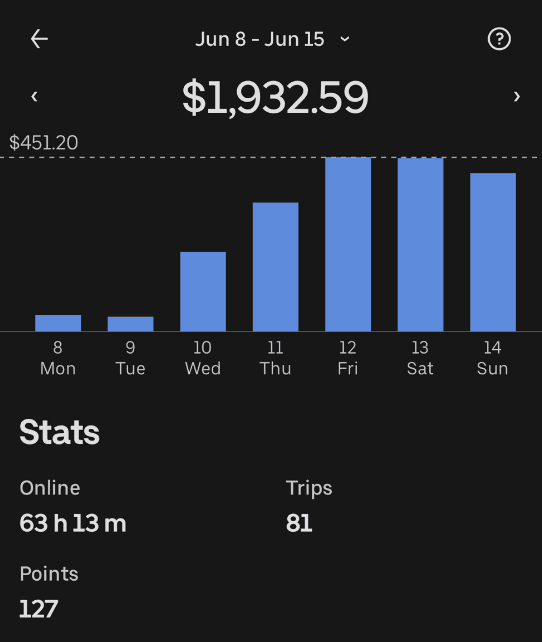
Week of
Jun 8 – Jun 15, 2026
This week’s range
$1,932.59 – $2,619.64
2 drivers
By the day
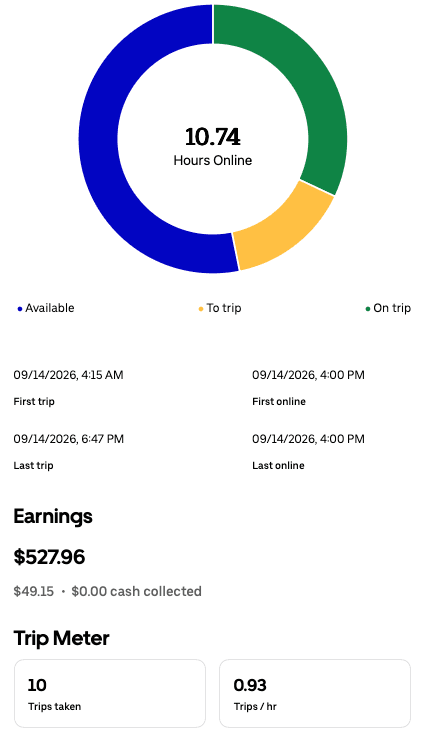
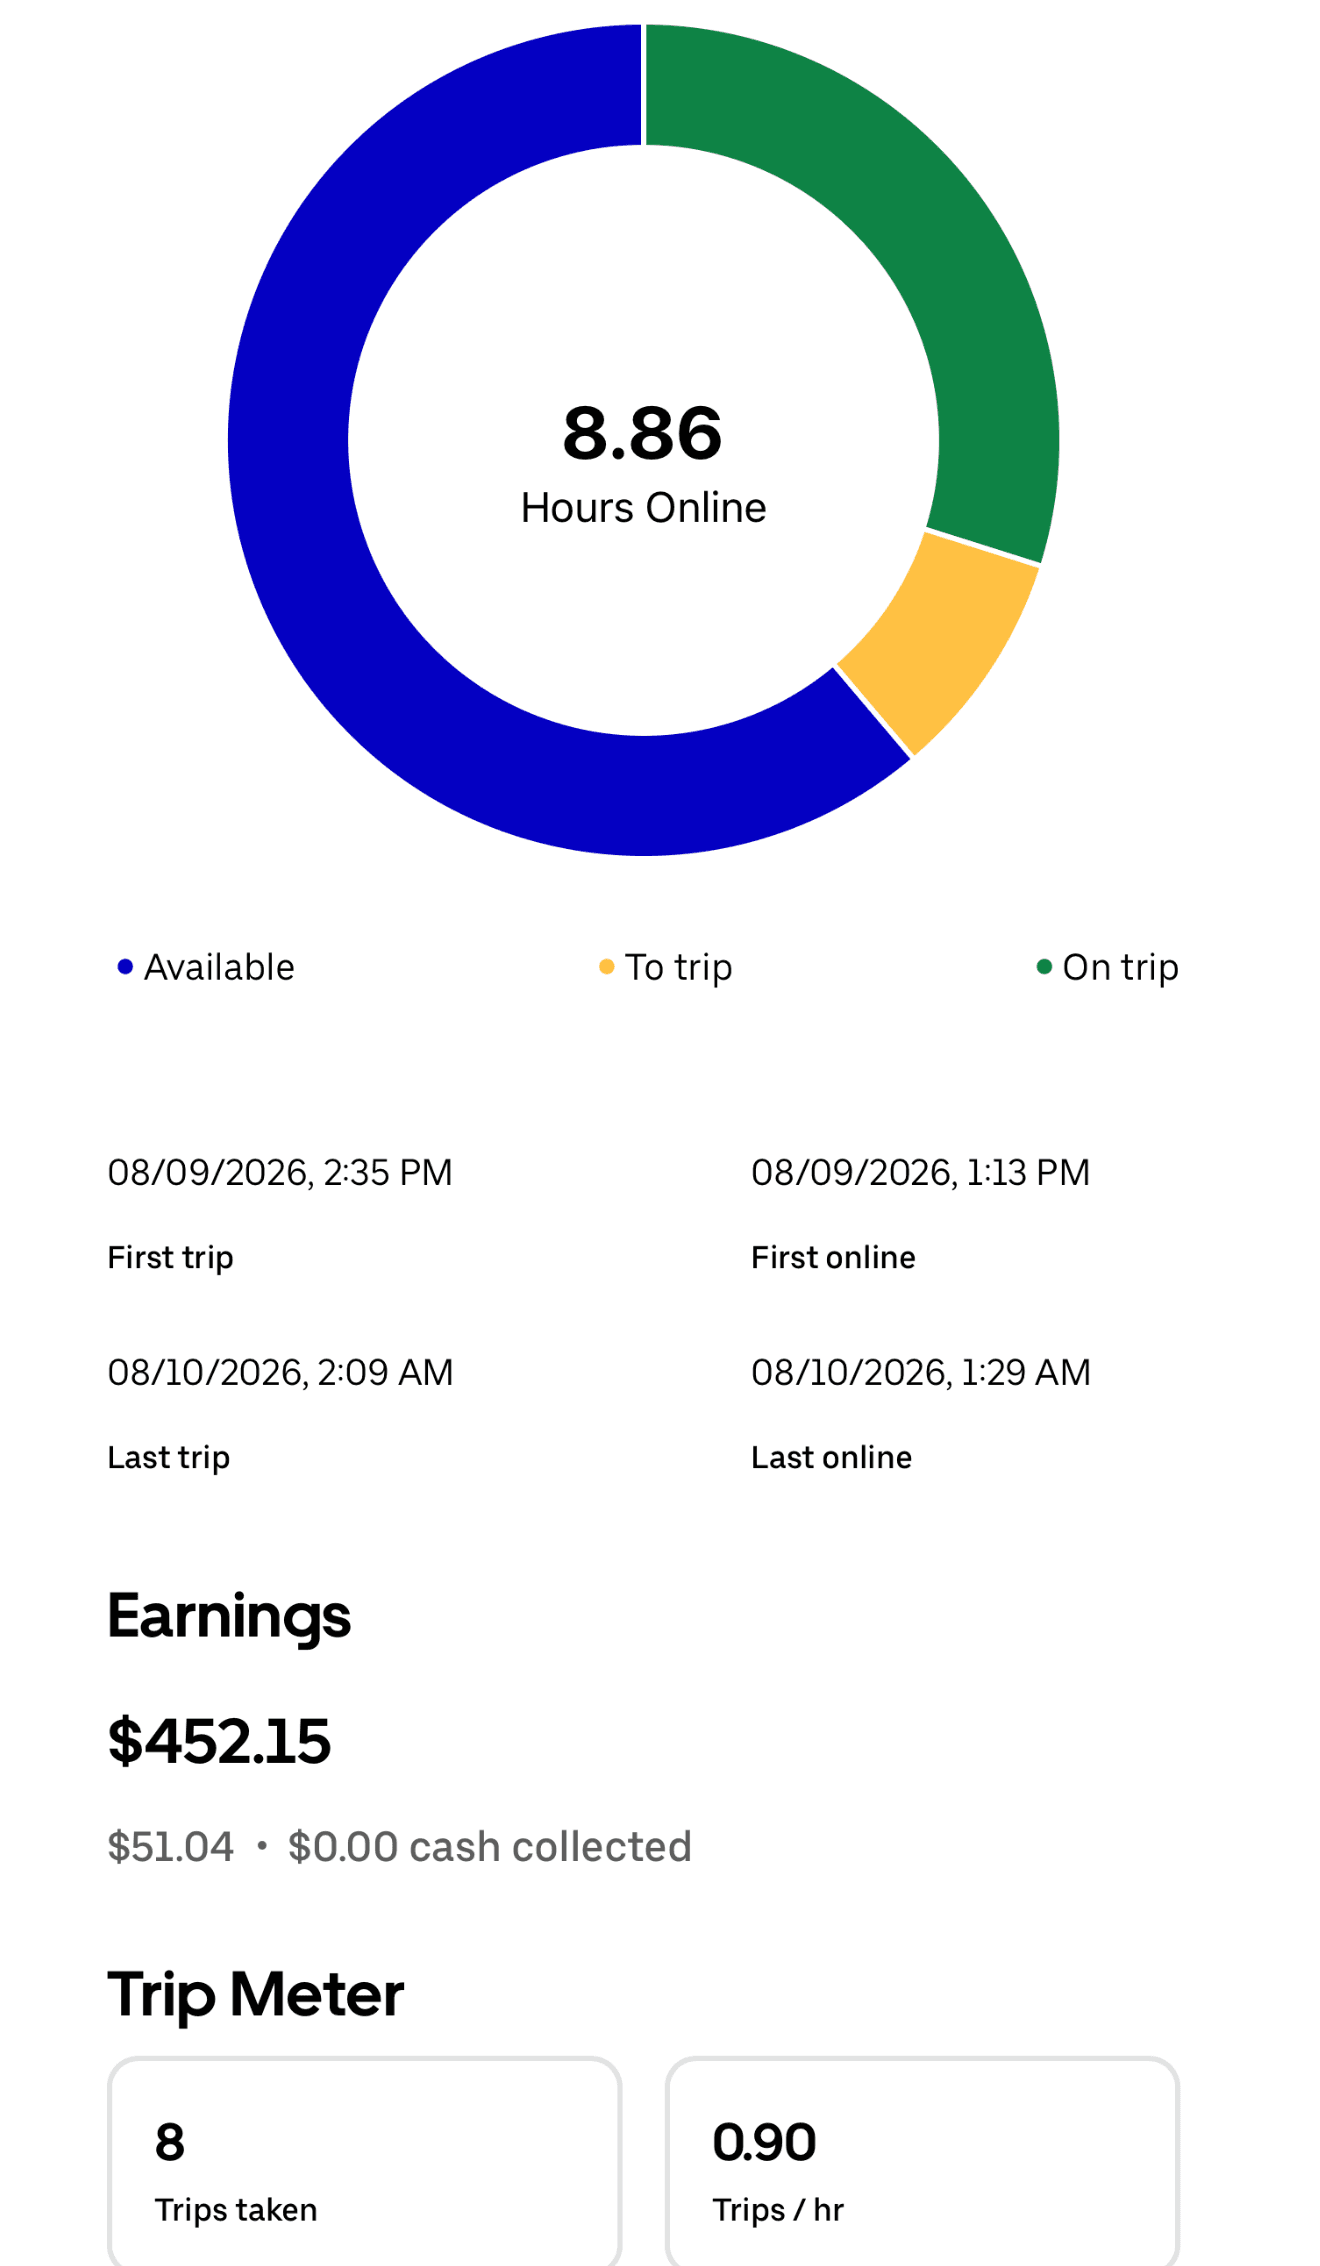
Single-day driver app summaries. These days fall inside the weeks above, so they are shown separately rather than added to them.
Sample planning tool
What would you keep each week?
Change any number below. This is an example, not a quote — but the costs listed are the only ones a weekly rental driver pays us. Tickets, tolls and airport fees are not automatic: depending on where and how you choose to drive in town, that line can be $0.
Already covered — $0 from you
- ✓ Maintenance, tires, brakes, oil
- ✓ Insurance
- ✓ Unlimited miles
- ✓ Detailing, Uber inspections, registration
Estimated weekly net, before income tax
$1,215
Gross earnings less rental, fuel, and any tickets, tolls or airport fees.
Example only. You are an independent contractor, so income tax is not withheld and is not shown here. Earnings and expenses vary by driver, vehicle, hours, demand, fuel prices and individual decisions. No earnings are guaranteed. Rent-to-own drivers carry their own full-coverage insurance — add that cost when comparing the ownership path.
What a $3,000 app-reported week could look like
This planning illustration compares the same example week across currently listed rentals. It is not a forecast, driver average, or typical result.
| Vehicle | Example app-reported earnings | Weekly rental | Gas (10–15%) | Est. before-tax remainder |
|---|---|---|---|---|
| Cadillac Escalade ESV (2024) | $3,000 | −$1,400 | −$300 to −$450 | $1,150–$1,300 |
| Ford Expedition (2021) | $3,000 | −$1,260 | −$300 to −$450 | $1,290–$1,440 |
| Ford Expedition Max (2025) | $3,000 | −$1,260 | −$300 to −$450 | $1,290–$1,440 |
| Chevrolet Suburban (2024) | $3,000 | −$1,360 | −$300 to −$450 | $1,190–$1,340 |
| Lincoln Corsair (2022) | $3,000 | −$1,060 | −$300 to −$450 | $1,490–$1,640 |
| Lincoln Nautilus (2021) | $3,000 | −$1,060 | −$300 to −$450 | $1,490–$1,640 |
Unlimited mileage and 100% covered maintenance are already included in the rental. This illustration does not include taxes or other driver-specific expenses.
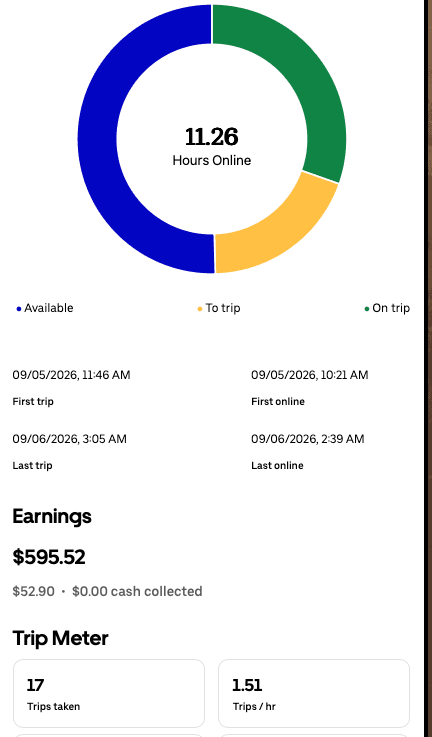
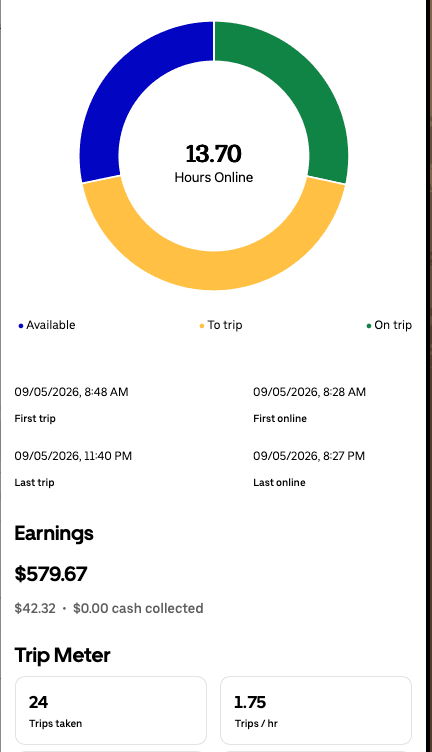
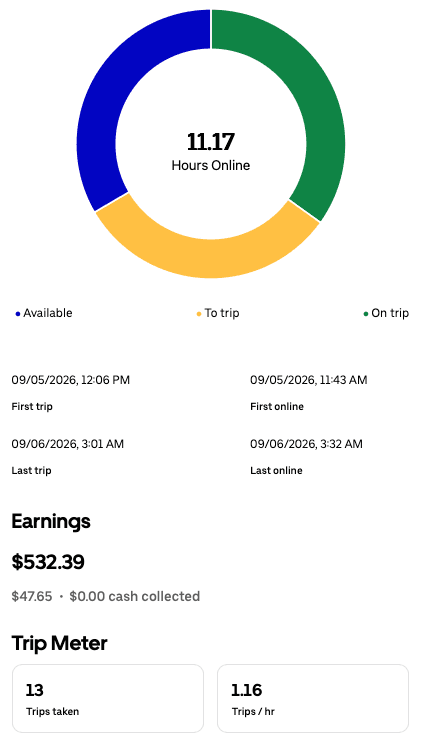
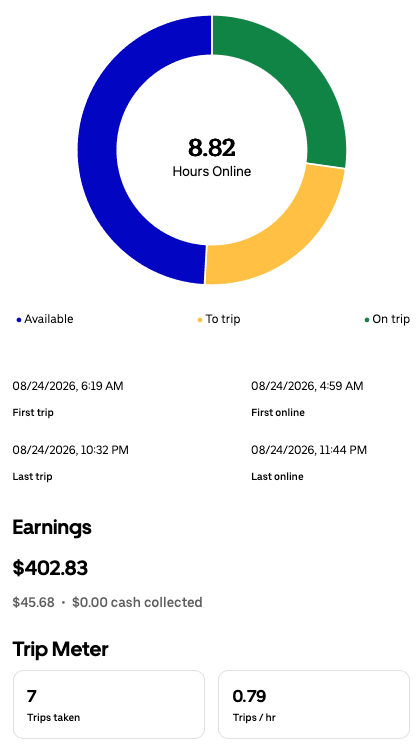
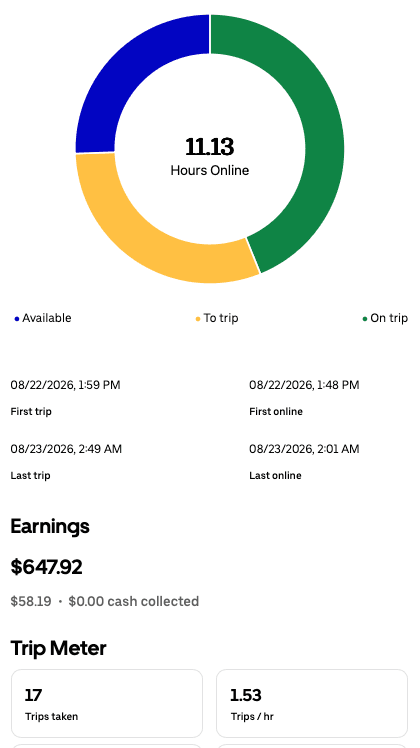
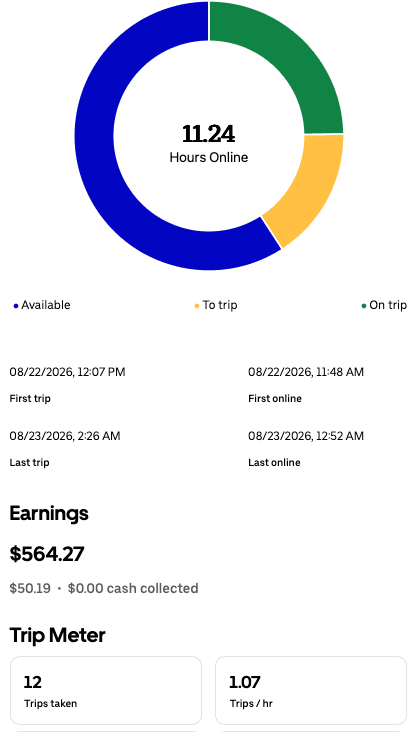
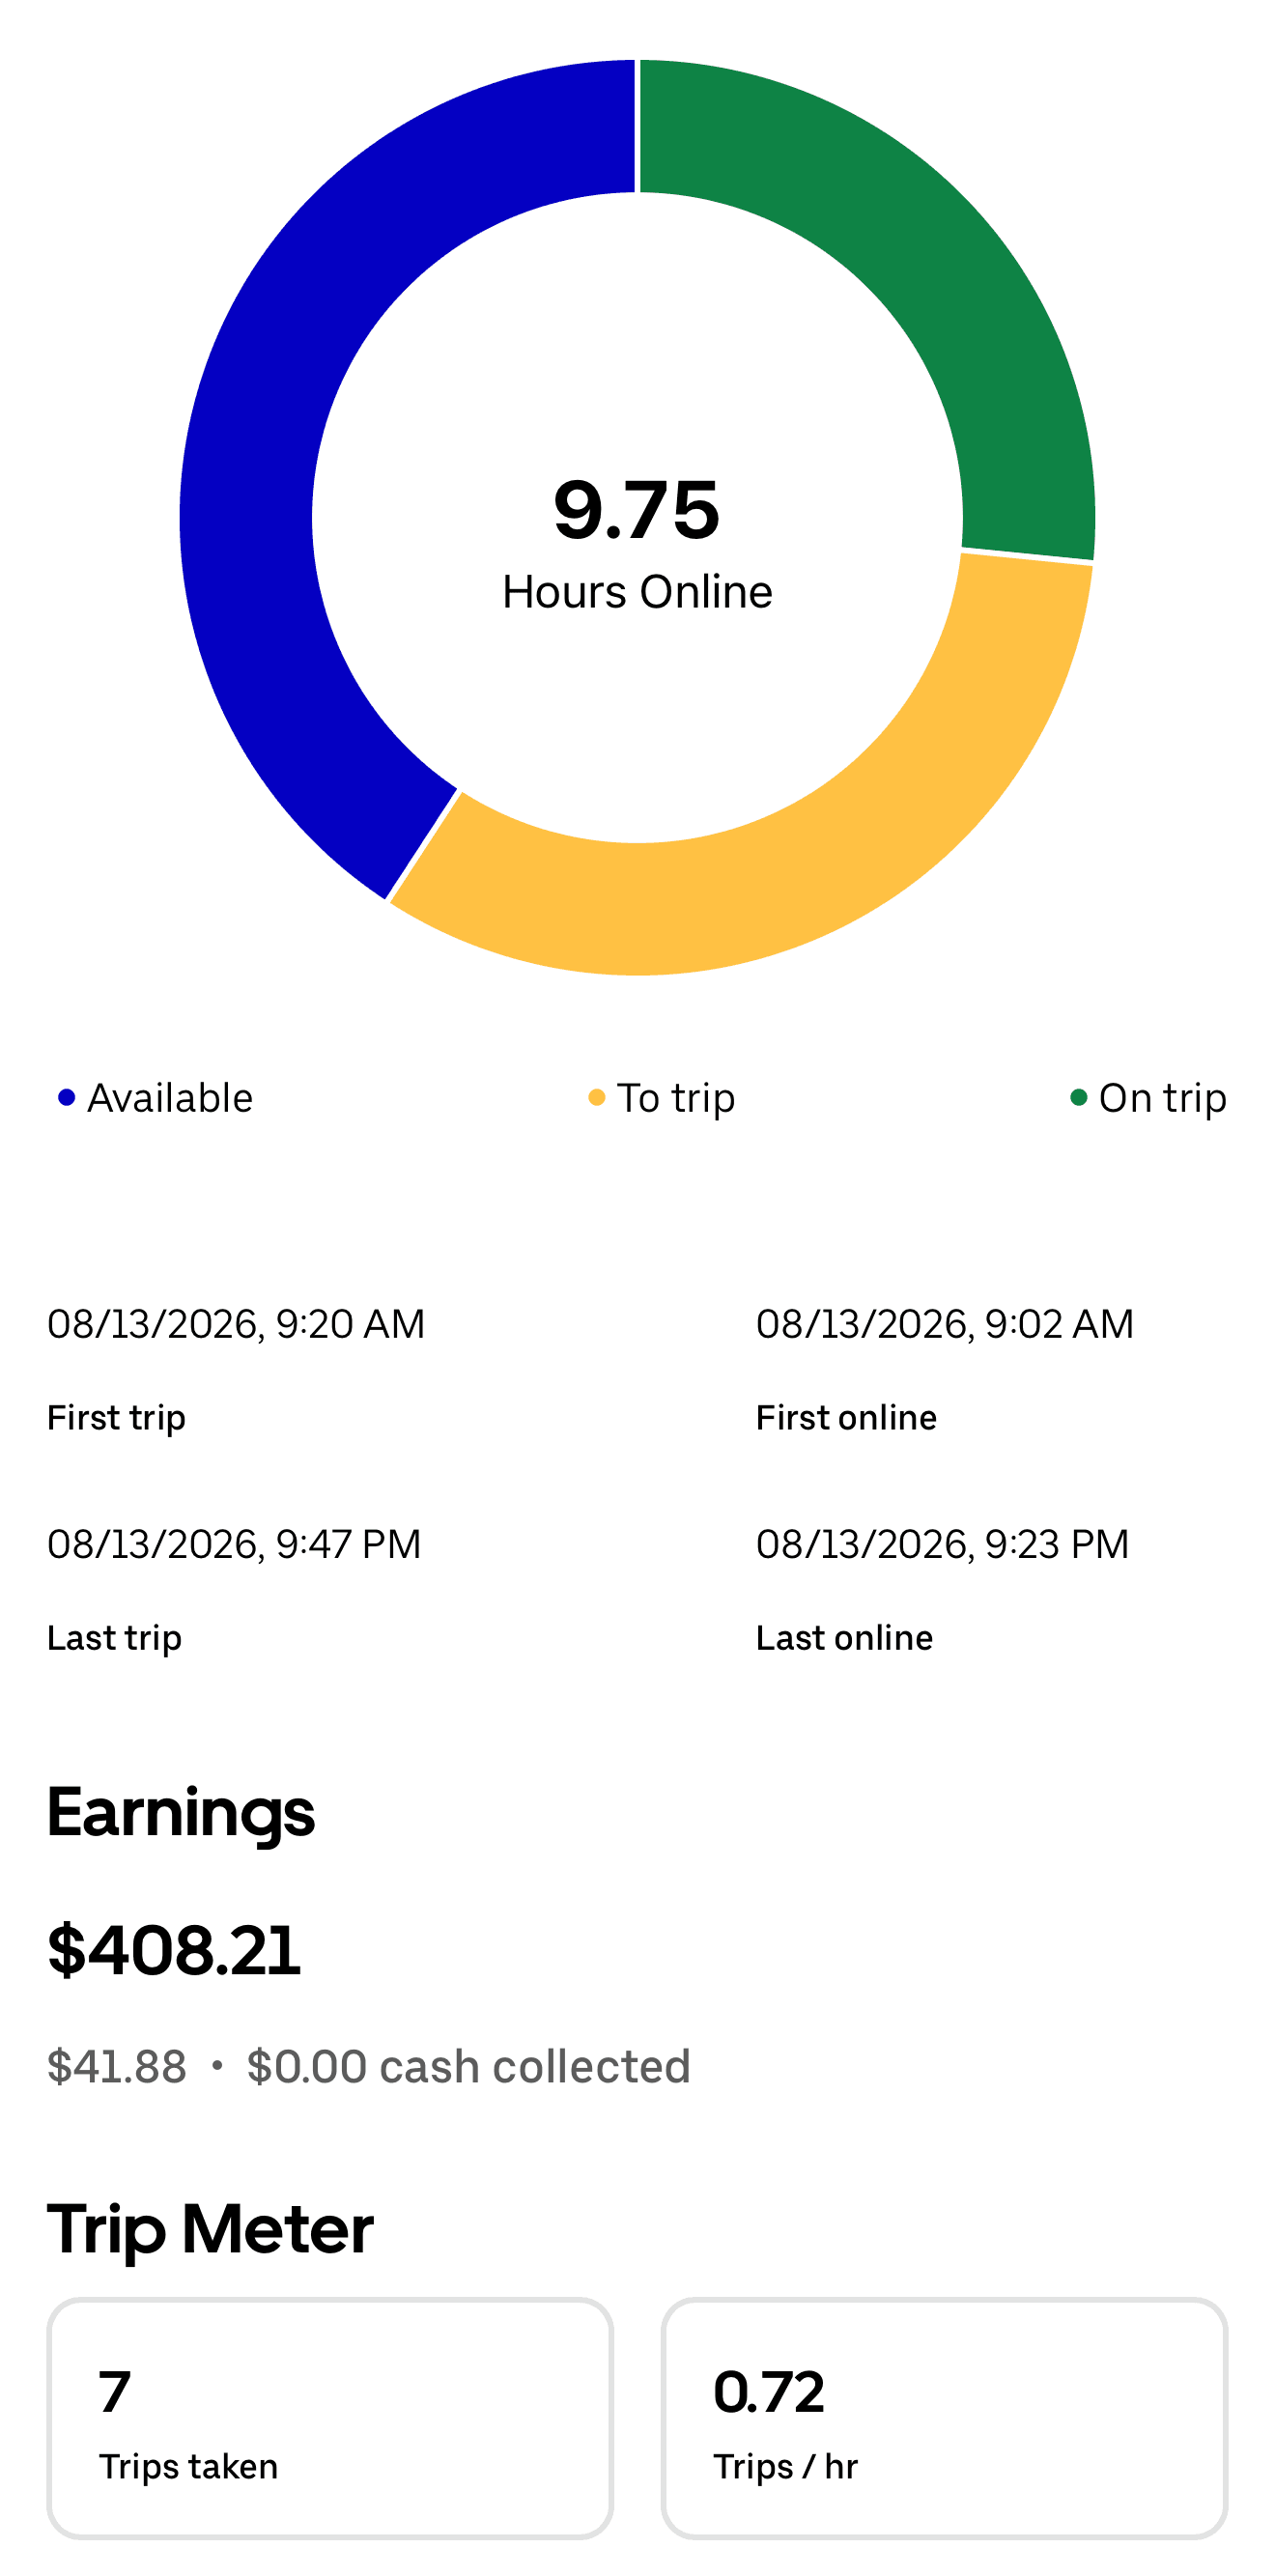
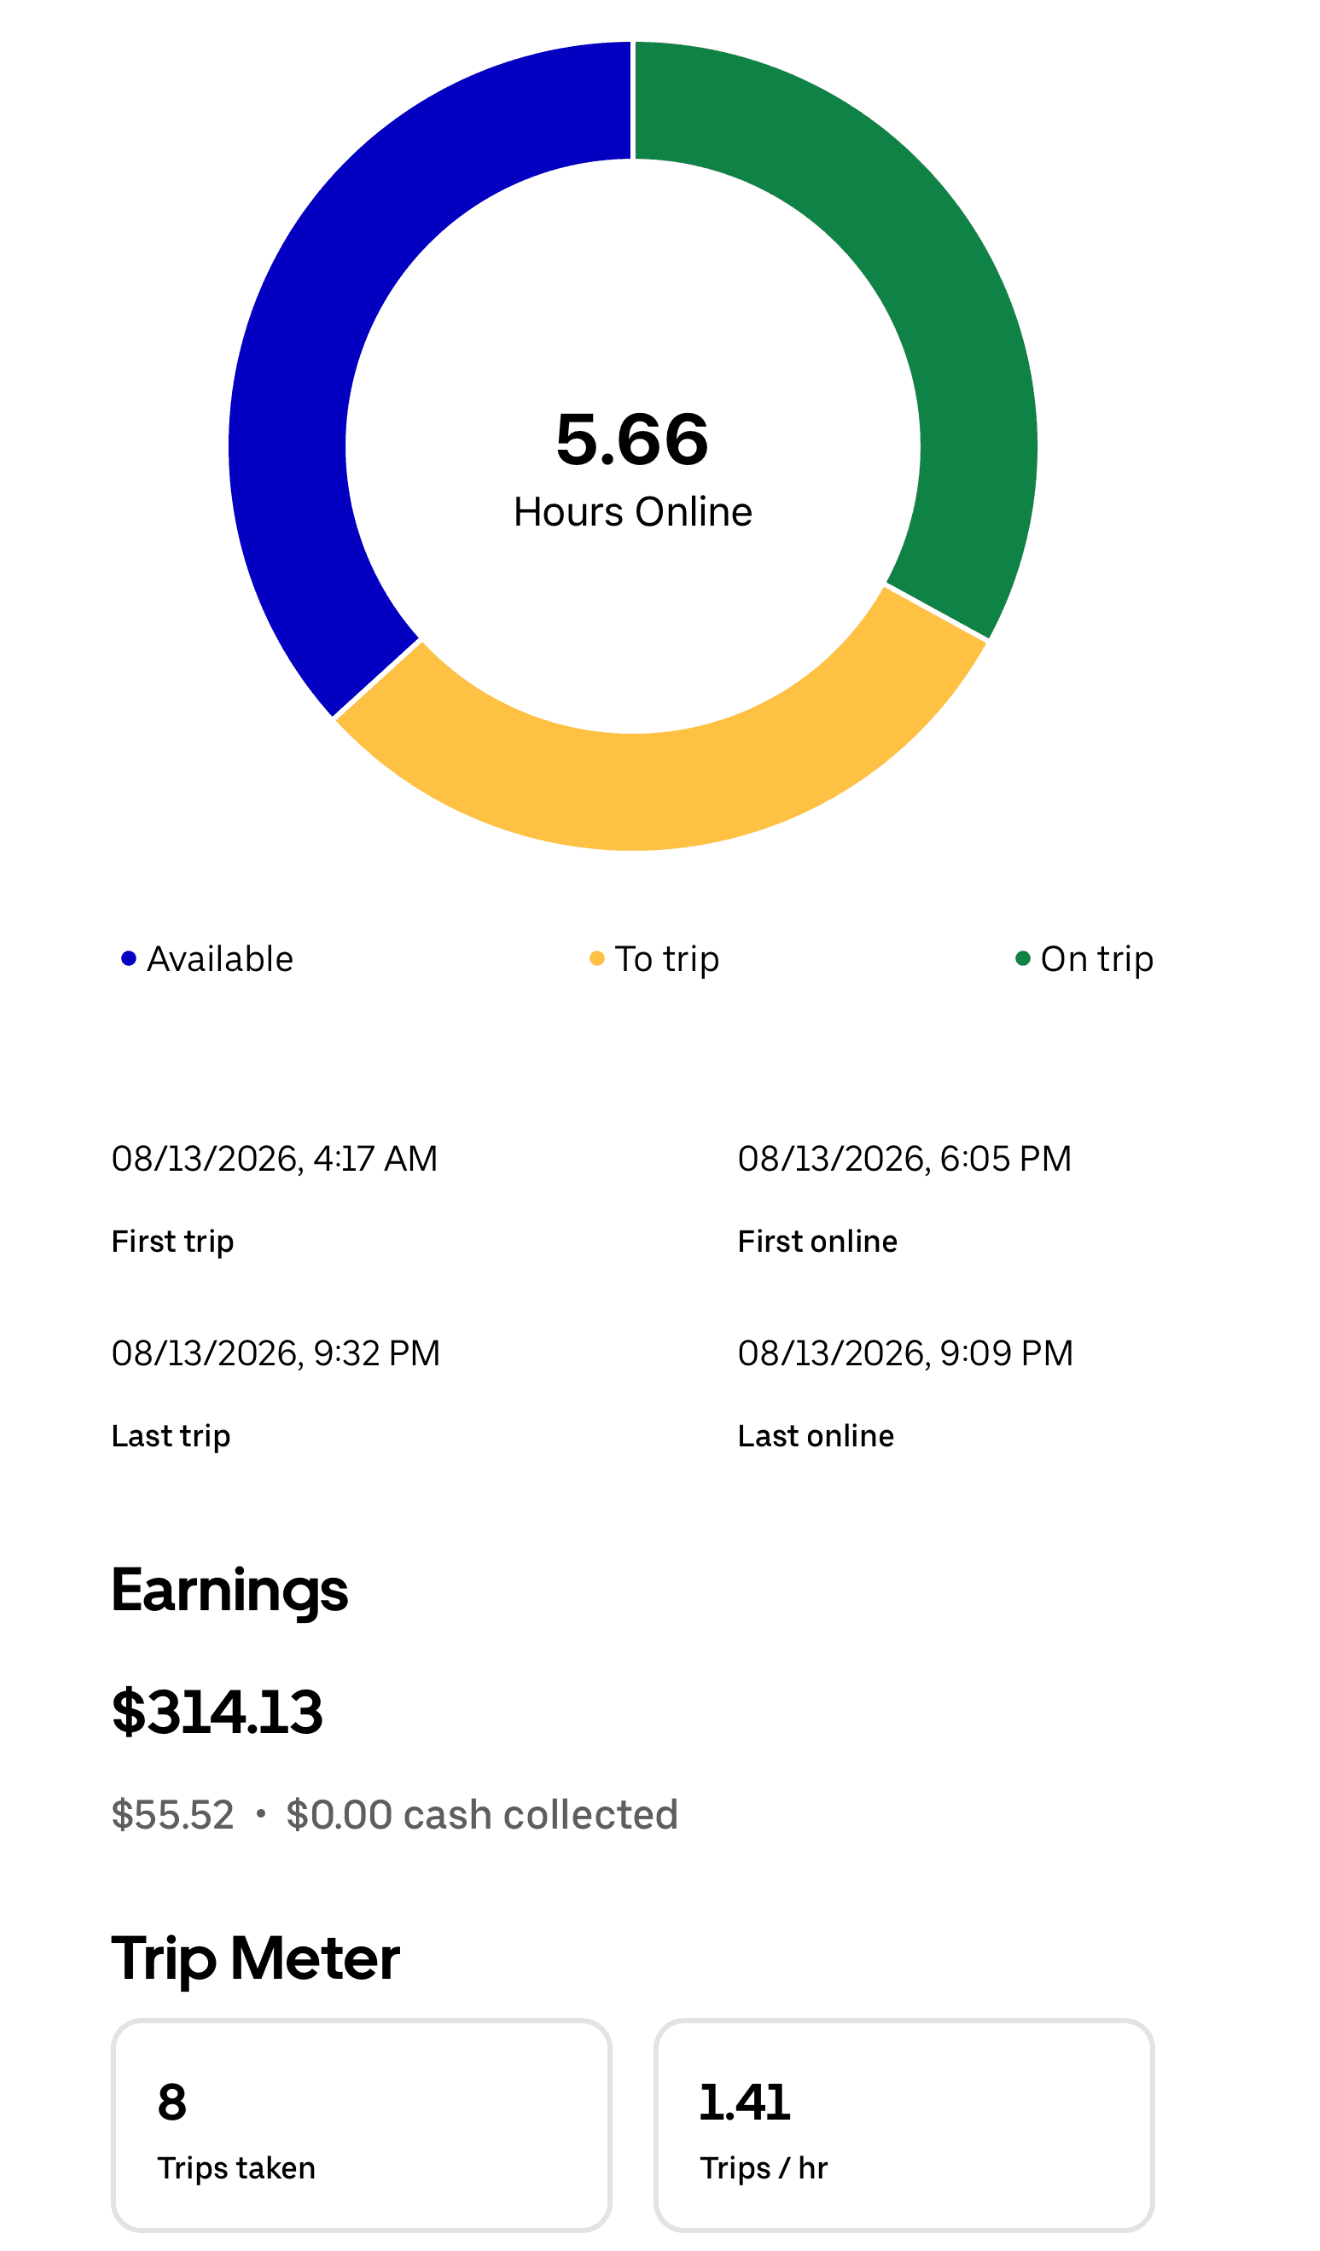
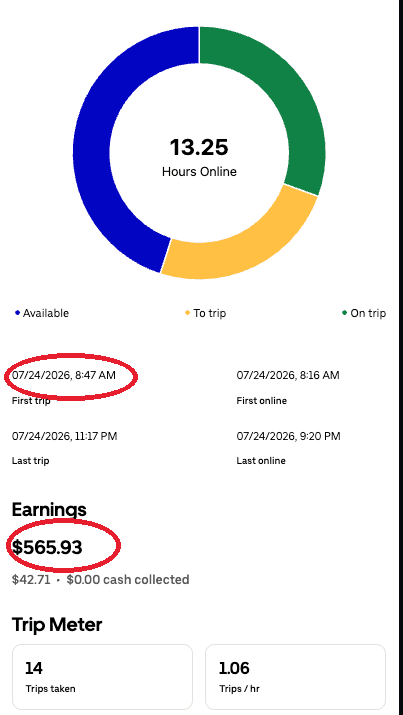
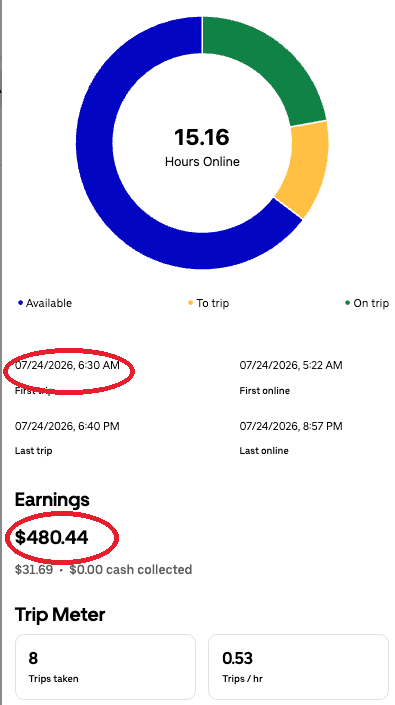
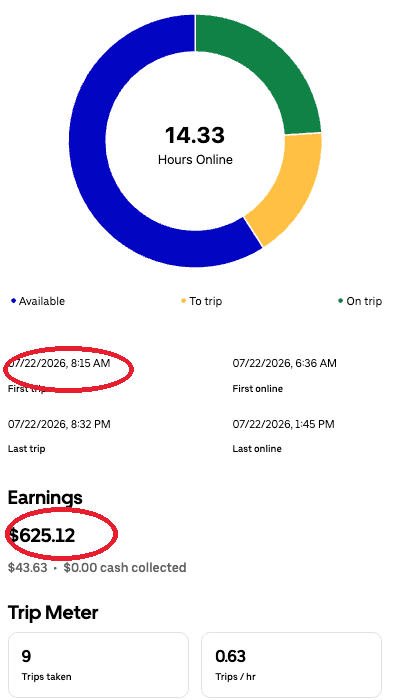
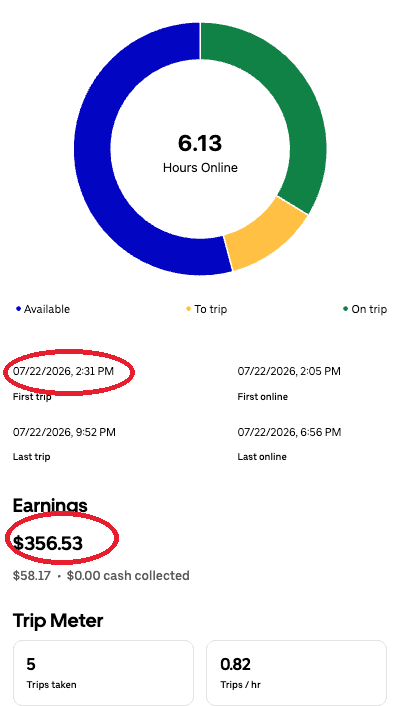
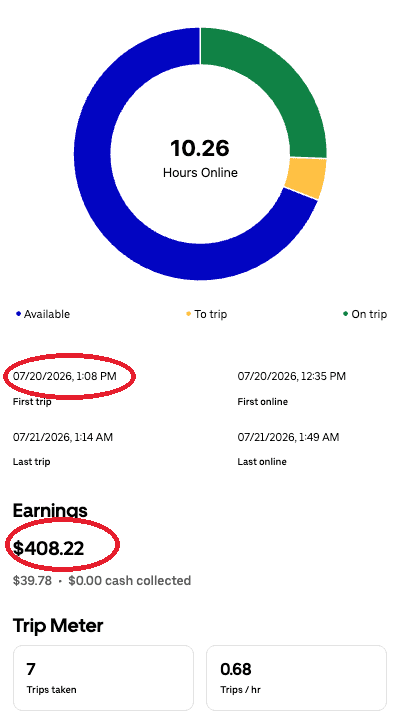
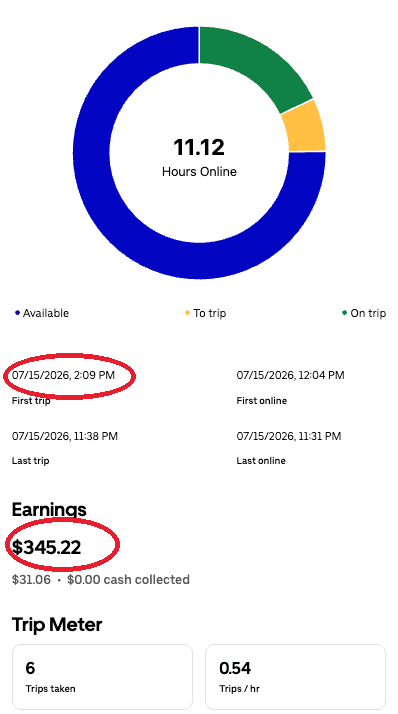
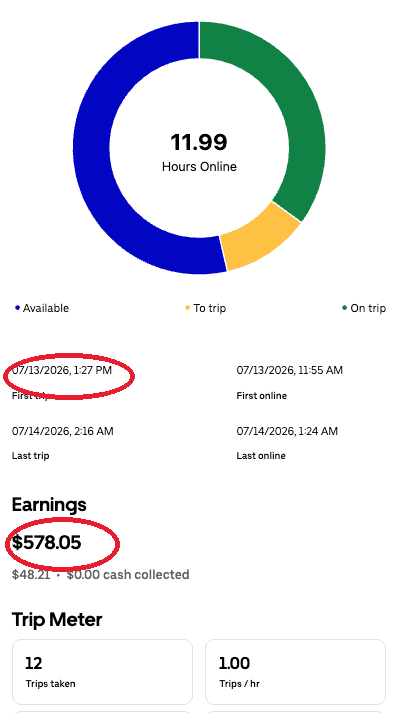
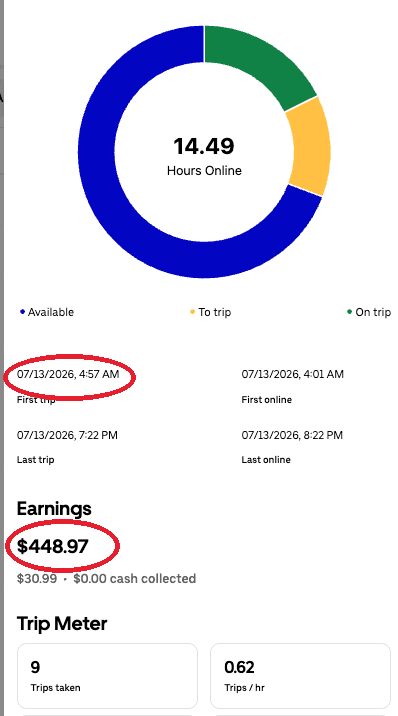
Day by day: what drivers actually logged
Single-day app summaries from drivers in our fleet. Every one of these days is a real screenshot, shown with the hours online and trips that produced it.
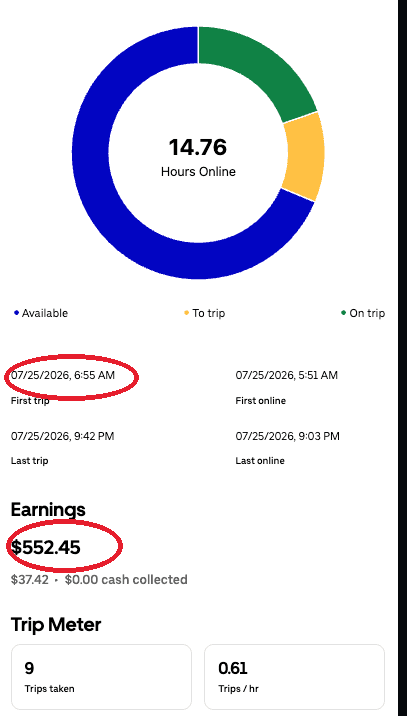
Every early start on this page finished above $400.
Of the 9 days below, the 5 where the driver's first trip was before 9 AM ranged from $448.97 to $625.12 and averaged $534.58. The days that started in the afternoon were the ones that came in under $400.
Getting out early is the single biggest thing a driver controls. Results still depend on your acceptance rate, how many hours you stay online, and Uber demand that day.
Earnings disclosure — read this
Every screenshot on this page is a real, historical, app-reported result from a driver in our fleet, published unedited. They are posted so you can see what has actually been possible — including the slow weeks and the slow days, which stay up alongside the strong ones.
They are not a guarantee of what you will earn. No figure here is take-home income, an average, a typical result, an estimate, or a promise. The screenshots show gross earnings and do not deduct rental payments, fuel, tolls, taxes, or other expenses. What any individual driver earns depends on the hours they put in, how many trips they accept, their own driving profile and decisions, their standing on the platform, and the particular market conditions of that week — demand, trip mix, fares, tips and promotions. Online time may include waiting. Past results do not predict future earnings. 513 Black Car Rental is an independent vehicle provider and is not affiliated with or endorsed by Uber Technologies, Inc.